PitVis-2023挑战赛:内镜下垂体瘤手术视频中的手术流程识别|文献速递-深度学习人工智能医疗图像
Title
题目
PitVis-2023 challenge: Workflow recognition in videos of endoscopic pituitary surgery
PitVis-2023挑战赛:内镜下垂体瘤手术视频中的手术流程识别
01
文献速递介绍
内镜视觉挑战赛与PitVis-2023挑战赛背景及核心内容 “内镜视觉(EndoVis)挑战赛”自2015年起开始举办,由医学图像计算与计算机辅助干预学会(MICCAI Society)主办(Maier-Hein 等人,2022)。该赛事涵盖一系列与微创手术计算机视觉相关的挑战任务:从2015年的结肠镜视频息肉检测,到2022年的根治性前列腺切除术视频动作识别(Maier-Hein 等人,2022)。对于微创手术计算机视觉领域的研究群体而言,EndoVis挑战赛的价值体现在两方面:一是推动现有模型的性能边界不断突破(Maier-Hein 等人,2022);二是提供经过精心整理的公开数据集(Maier-Hein 等人,2022)。 在此基础上,“垂体视觉(PitVis)2023挑战赛”作为EndoVis-2023挑战赛的子挑战应运而生(Speidel 等人,2023)。该挑战赛的核心任务是:对“内镜经蝶窦入路垂体瘤切除术(eTSA)”视频中的手术步骤与器械进行识别。 垂体位于脑底部(Ganapathy 与 Tadi,2022)。垂体前叶肿瘤(即垂体瘤)在普通人群中的预估患病率约为1/1000(Russ 等人,2022;Agustsson 等人,2015)。其典型症状包括视力损伤(Russ 等人,2022;Ogra 等人,2014)与激素失衡(Ganapathy 与 Tadi,2022;Russ 等人,2022)。若不及时治疗,这些有症状的垂体瘤可能导致失明(Russ 等人,2022;Ogra 等人,2014);在库欣病等特定病例中,甚至可能危及生命(Russ 等人,2022;Tritos 与 Biller,2019)。对于大多数有症状的垂体瘤患者,手术是首选治疗方案,且通常采用内镜经蝶窦入路(eTSA)(Ganapathy 与 Tadi,2022;Wang 等人,2014)。 内镜经蝶窦入路(eTSA,又称内镜下垂体瘤手术)是一种微创手术,医生通过患者鼻孔进入体内切除肿瘤,如图1(a)所示(Wang 等人,2014;Marcus 等人,2021)。内镜可帮助医生观察患者体内情况,其摄像头拍摄的画面会投射到显示器上,同时需配合手术器械使用,如图1(b)所示(Wang 等人,2014;Marcus 等人,2021)。目前,内镜经蝶窦入路手术的操作流程尚未标准化(Consortium,2023),因此手术效果存在差异(Wang 等人,2014)。此外,该手术操作难度大,需经过专门的亚专科培训才能熟练掌握(Frara 等人,2020)。 手术流程分析会将整个手术过程拆解为多个组成部分(Lalys 与 Jannin,2013)。从最高层级来看,手术会被划分为多个“手术阶段”,每个阶段对应一个主要手术事件(Lalys 与 Jannin,2013);而每个阶段又可进一步细分为多个更具体的“手术步骤”(Lalys 与 Jannin,2013)。在本研究中,每个手术步骤都需通过使用特定手术器械来实现特定的手术目标(Marcus 等人,2021)。通过这种拆解方式,医生能够定位手术中可能出现技术失误的环节,以及这些失误如何导致不良事件(Marcus 等人,2021)。 然而,要实现手术流程分析的价值,存在一个主要限制因素:需由专业外科医生逐例分析手术过程,这会耗费大量时间与人力成本,给本就超负荷运转的医疗系统带来额外负担(Wang 等人,2022)。对于内镜经蝶窦入路这类微创手术,还需医生手动为每段手术视频添加标注(Marcus 等人,2021)。因此,自动化手术流程分析(通常称为“手术流程识别”)可大幅降低此类成本,实现规模化分析(Garrow 等人,2020)。 手术流程识别的临床价值主要体现在三方面:第一,通过交互式视频与自动化性能指标为年轻外科医生提供培训指导,已有研究表明这种方式可提升手术操作水平(Khan 等人,2024b、c);第二,术后可自动记录已执行的手术步骤与使用的器械(Das 等人,2023a;He 等人,2024),减少医生撰写手术记录的时间,进而提高手术周转效率(Khan 等人,2023;Das 等人,2023a);第三,术中可自动向手术室其他团队成员(如麻醉师、手术室护士)告知即将开始的新步骤或所需的新器械(Das 等人,2024;Khan 等人,2024a),有望提升手术室整体效率(Khan 等人,2023;Garrow 等人,2020)。 正是基于这些临床价值,PitVis-2023挑战赛得以发起。该挑战赛包含三项任务:(1)手术步骤识别;(2)手术器械识别;(3)手术步骤与器械联合识别。赛事为参赛者提供了25段公开的训练视频,且每段视频都附带每秒对应的“当前手术步骤”与“当前使用器械”标注;参赛模型需在8段私有测试视频上进行性能评估。对于25段公开训练视频,赛事建议按“20段训练+5段验证”的比例划分,并提供了基于这5段验证视频的基准结果,供未来研究构建模型时参考对比。根据模型在8段测试视频上的表现,赛事为三项任务中表现前两名的模型分别提供了总金额达3000英镑的奖金。性能评估指标既包含空间维度的F1分数,也包含时间维度的编辑分数(Edit-score)。 本次挑战赛共收到来自6个国家9支团队的18份参赛方案。参赛模型类型多样,既有仅采用卷积神经网络(CNN)实现纯空间编码的模型,也有结合长短期记忆网络(LSTM)的时空联合建模方法;Transformer模型也被应用其中,且在手术步骤识别与器械识别任务中均展现出良好效果。所有三项任务中表现最优的模型均存在一个共性:采用了时空表征学习。在“CNN+LSTM”架构模型中,这一特性通过层级时间建模实现(例如使用双层LSTM);在Transformer架构模型中,则通过帧排序(例如使用位置编码)实现。 PitVis-2023挑战赛的主要贡献包括: 1. 对适用于内镜下垂体瘤手术的最先进手术流程识别模型进行了全面分析——相比以往的手术步骤识别研究,本次分析粒度更细,且首次针对该手术开展器械识别相关研究; 2. 提供了内镜下垂体瘤手术流程识别的基准结果——凸显了这一尚未被研究界探索的独特手术所面临的挑战; 3. 构建了首个经过精心整理的内镜下垂体瘤手术公开数据集——包含25段视频,且每一秒都标注了对应的手术步骤与使用器械; 4. 成功举办了关注度较高的内镜下垂体瘤手术相关计算机视觉挑战赛——吸引了来自6个国家9支团队提交的18份参赛方案。 PitVis-2023挑战赛遵循《生物医学图像分析挑战赛透明报告指南》(BIAS指南)(Speidel 等人,2023;Maier-Hein 等人,2020)³。本文同样遵循该指南,具体细节可参见补充材料。
Abatract
摘要
The field of computer vision applied to videos of minimally invasive surgery is ever-growing. Workflowrecognition pertains to the automated recognition of various aspects of a surgery, including: which surgicalsteps are performed; and which surgical instruments are used. This information can later be used to assistclinicians when learning the surgery or during live surgery. The Pituitary Vision (PitVis) 2023 Challengetasks the community to step and instrument recognition in videos of endoscopic pituitary surgery. This isa particularly challenging task when compared to other minimally invasive surgeries due to: the smallerworking space, which limits and distorts vision; and higher frequency of instrument and step switching, whichrequires more precise model predictions. Participants were provided with 25-videos, with results presented atthe MICCAI-2023 conference as part of the Endoscopic Vision 2023 Challenge in Vancouver, Canada, on 08-Oct-2023. There were 18-submissions from 9-teams across 6-countries, using a variety of deep learning models.The top performing model for step recognition utilised a transformer based architecture, uniquely using anautoregressive decoder with a positional encoding input. The top performing model for instrument recognition
计算机视觉在微创外科手术视频中的应用领域持续发展 手术流程识别旨在对手术的各个方面进行自动识别,具体包括:当前执行的是哪一手术步骤、使用的是何种手术器械。这些信息后续可用于在临床医生学习手术操作时提供辅助,或在实时手术过程中提供支持。 “垂体视觉(PitVis)2023挑战赛”(Pituitary Vision 2023 Challenge)面向研究界设置的任务是:对内镜下垂体瘤手术视频中的手术步骤与器械进行识别。相较于其他微创手术,该任务难度尤为突出,原因在于:其一,手术操作空间更小,会对视野造成限制与干扰;其二,器械更换与步骤切换的频率更高,这对模型的预测精度提出了更严苛的要求。 赛事为参赛者提供了25段手术视频,最终结果于2023年10月8日在加拿大温哥华举办的“医学图像计算与计算机辅助干预国际会议(MICCAI-2023)”上公布,作为“2023年内镜视觉挑战赛”(Endoscopic Vision 2023 Challenge)的组成部分。此次挑战赛共收到来自6个国家9支团队的18份参赛方案,参赛团队采用了多种深度学习模型。 在手术步骤识别任务中,表现最优的模型采用了基于Transformer的架构,其独特之处在于将位置编码输入与自回归解码器相结合;而在手术器械识别任务中,表现最优的模型
Method
方法
Table 2 displays a summary of the 9-teams from 6-countries, andthe corresponding 18-submissions: 7 for Task-1; 6 for Task-2; and 5for Task-3. All models use either a Spatial Encoder (S-E) (CNN; S-TF)or Spatio-Temporal Encoder (ST-E) (ST-TF), with the majority using atemporal encoder (LSTM; TCN; T-TF), and a few perform online postprocessing (TSF). There are some which use multiple neural networksand combine them via an Ensemble. Detailed architectural diagrams ofall models are displayed in Fig. 9.Tables 3 and 4 display a summary of the training parameters andimage augmentations. Although there are a few commonalities betweenthe methods (Cross-Entropy Loss Function (CE) loss function; resizinginput images), there are vast differences. The majority do not implement strong image augmentations; or any data balancing, whereas amajority do use the suggested validation split; pre-train on ImageNet;or use Adaptive Moment Estimation (Adam) for backpropagation. Theremaining parameters are even: some use Rectified Linear Unit (ReLU);some remove the black borders of an image; and some use the taskevaluation metric.The remainder of this section provides an overview of each model(in alphabetical order by team name):
参赛团队、模型架构及训练参数概述 表2汇总了来自6个国家的9支参赛团队及对应的18份参赛方案:其中7份针对任务1(手术步骤识别),6份针对任务2(手术器械识别),5份针对任务3(手术步骤与器械联合识别)。所有模型均采用空间编码器(S-E,如卷积神经网络CNN、空间Transformer(S-TF))或时空编码器(ST-E,如时空Transformer(ST-TF));多数模型搭配时间编码器(如长短期记忆网络LSTM、时序卷积网络TCN、时间Transformer(T-TF)),少数模型采用在线后处理(如时序融合TSF)。部分模型采用多个神经网络,并通过集成(Ensemble)方法进行融合。所有模型的详细架构图见图9。 表3与表4汇总了各模型的训练参数与图像增强策略。尽管不同方法间存在少量共性(如均使用交叉熵损失函数(CE)、对输入图像进行尺寸调整),但差异仍十分显著:多数模型未采用强效图像增强手段,也未实施数据平衡策略;而多数模型会采用赛事建议的验证集划分方式、在ImageNet数据集上进行预训练,或使用自适应矩估计(Adam)优化器进行反向传播。其余参数的采用情况则较为均衡:部分模型使用ReLU激活函数,部分会移除图像的黑边,还有部分会采用任务对应的评估指标(指导训练)。 本节后续内容将按团队名称首字母顺序,对各参赛模型进行概述。
Conclusion
结论
7.1. Principal findings
The PitVis-2023 challenge pertains to developing deep learningmodels for workflow recognition for the eTSA, with 3-tasks: (1) 12-step multi-class recognition; (2) 18-instrument multi-label recognition;and (3) 12-step and 18-instrument multi-task recognition. It was runacross 5-months as a sub-challenge of the EndoVis-2023 challenge, withresults and awards presented at the MICCAI-2023 conference hostedin Vancouver, Canada on 08-Oct-2023. Participants were given accessto the first curated public dataset of eTSA: comprising 25-videos, withannotations for each second indicating the corresponding surgical stepand instrument used. Across the 3-tasks there were 18-submissions from9-teams across 6-countries.The 9-models utilise a variety of state-of-the-art computer visionand workflow recognition techniques and architectures. Training techniques include random augmentations; end-to-end training; multi-tasktraining; and data balancing. Architectures are generally split into 2-stages. Stage-1 consists of an encoder: either purely spatial via a CNNor S-TF; or spatial–temporal via a ST-TF. Stage-2 consists of a ST-D:either a LSTM or ST-TF. An optional third stage is often used to improveperformance, consisting of an online post-processing technique, usuallya TSF. Some models also utilise ensembles. Performance was foundto be strong for both established architectures (e.g. CNN + LSTM +TSF) as well as less established custom architectures utilising temporalpropagation. A commonality between the best architectures was the useof a ST-D and TSF
7.1 主要研究结果 PitVis-2023挑战赛聚焦于开发针对内镜下经蝶窦手术(eTSA)流程识别的深度学习模型,共设置3项任务:(1)12个手术步骤的多类别识别;(2)18种手术器械的多标签识别;(3)12个手术步骤与18种手术器械的多任务联合识别。 该挑战赛作为EndoVis-2023挑战赛的子任务,历时5个月开展,最终结果与奖项于2023年10月8日在加拿大温哥华举办的国际医学图像计算与计算机辅助干预会议(MICCAI-2023)上公布。赛事为参赛者提供了首个经过整理的eTSA公开数据集:包含25段手术视频,且每一秒均标注了对应的手术步骤与所用器械信息。在3项任务中,来自6个国家的9支团队共提交了18份参赛方案。 9支团队的模型采用了多种当前主流的计算机视觉与流程识别技术及架构,训练方法涵盖随机数据增强、端到端训练、多任务训练与数据平衡策略。模型架构普遍分为两阶段: 1. 第一阶段(编码器):分为纯空间编码(基于卷积神经网络CNN或空间Transformer(S-TF))与时空编码(基于时空Transformer(ST-TF))两类; 2. 第二阶段(时空解码器/处理器,ST-D):采用长短期记忆网络(LSTM)或时空Transformer(ST-TF)实现。 部分模型还会增设可选的第三阶段(在线后处理模块)以提升性能,该阶段通常采用时序融合(TSF)技术;另有部分模型通过集成(Ensemble)方法融合多个神经网络的结果。 从性能表现来看,无论是成熟的经典架构(如“CNN + LSTM + TSF”),还是尚未广泛应用、基于时序传播设计的自定义架构,均展现出较强的识别能力。而所有顶尖模型的共性特征在于:均采用了“时空解码器/处理器(ST-D)”与“时序融合(TSF)”模块。
Results
结果
6.1. Ranking method
Each video is considered one case of equal value, hence the rankingsare determined by the tasks’ evaluation metric mean-averaged acrossthe 8-testing-videos (no missing results).A Kruskal–Wallis test is run on the top-3 methods of each task(across the 8-testing-videos) to test the significance of the performances, with 𝑝 < 0.05 implying significance.
6.1 排名方法 每段视频均被视为同等价值的独立样本,因此排名由各任务的评估指标在8段测试视频上的平均值决定(无缺失结果)。 针对每个任务排名前3的模型,基于其在8段测试视频上的性能数据进行Kruskal–Wallis检验(非参数方差分析),以验证模型间性能差异的显著性。若检验结果满足p < 0.05,则表明模型间的性能差异具有统计学显著性。
Figure
图
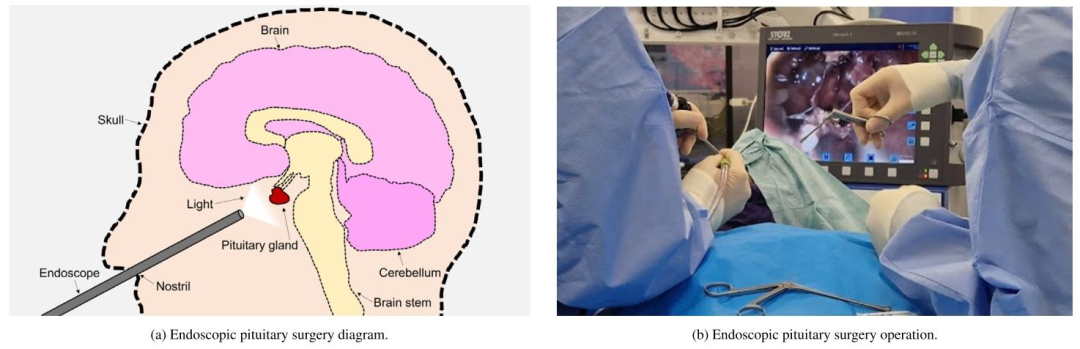
Fig. 1. Visual representations of endoscopic pituitary surgery. Notice the entry of the endoscope and instruments through the nostril, and the use of a light source and monitorto visualise the endoscopic video feed.
图1 内镜下垂体瘤手术的可视化示意图 图中可观察到以下关键信息:内镜与手术器械通过鼻孔进入体内的操作路径,以及用于呈现内镜视频画面的光源与显示器(二者为手术可视化的核心设备)。
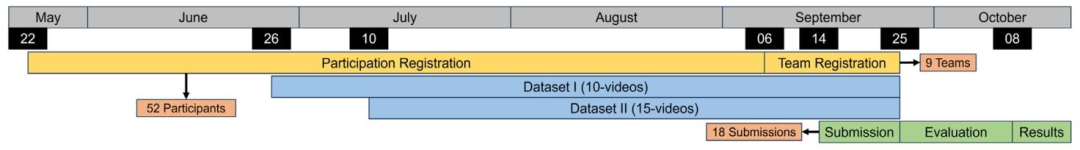
Fig. 2. A timeline of the challenge including dates of registration and dataset release. All dates are in 2023
图 2 挑战赛时间轴(含注册及数据集发布日期)
所有日期均为 2023 年。
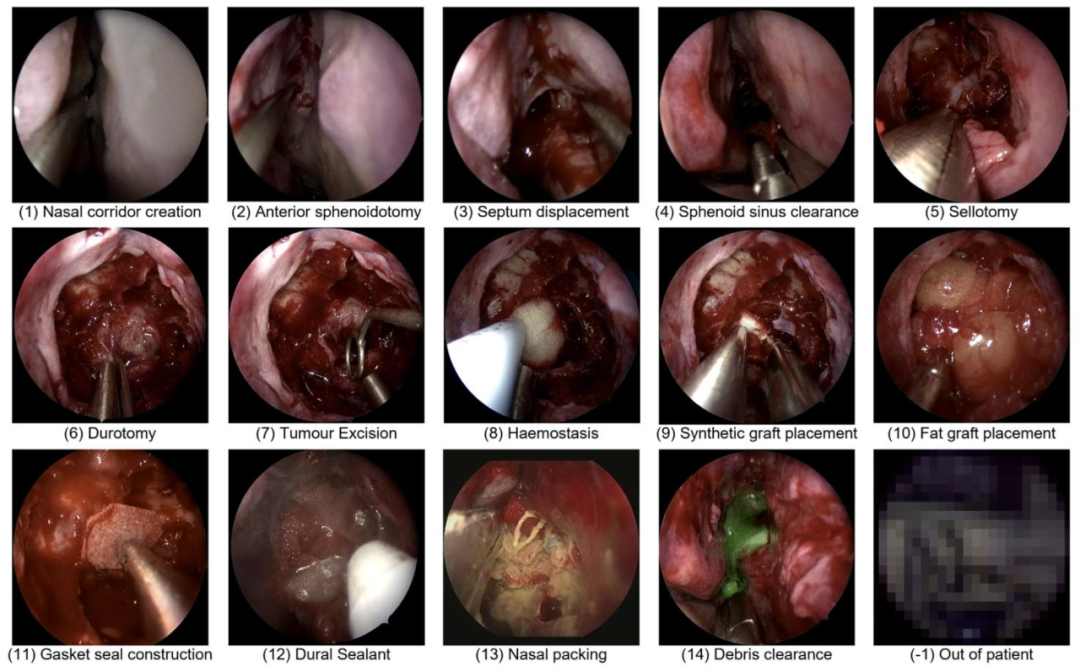
Fig. 3. Representative images of each of the 14-steps. Note step-11 and step-13 were not evaluated due to having insufficient volume to train on (Fig. 6), and ‘out of patient’ isnot considered a class.
图 3 14 个手术步骤的代表性图像
需注意:步骤 11(step-11)与步骤 13(step-13)因可用于训练的数据量不足(见图 6),未纳入本次挑战赛的评估范围;此外,“患者体外操作(out of patient)” 不被视为一个独立的手术步骤类别。
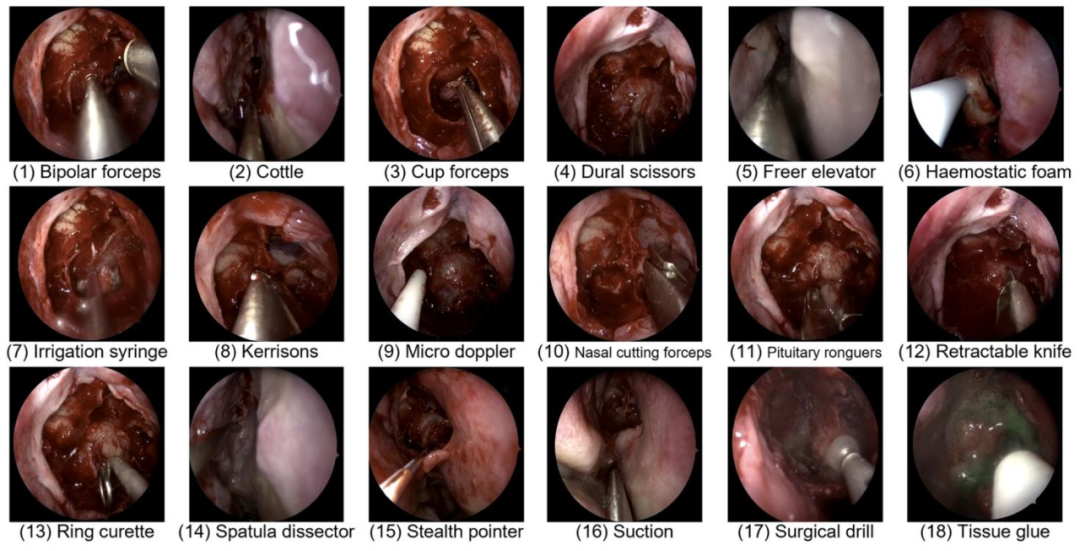
Fig. 4. Representative images of each of the 18-instruments, excluding the ‘no instrument’ class.
图4 18种手术器械的代表性图像,不含“无器械”类别。
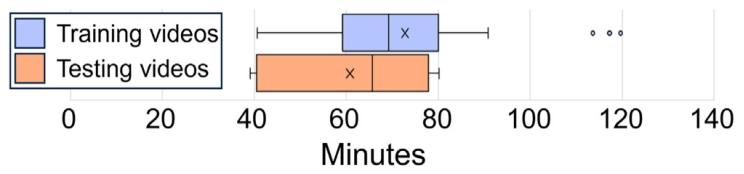
Fig. 5.Length distribution of the 25-training and 8-testing videos without the ‘out ofpatient’ class displayed as a box-whisker diagram. The middle horizontal line displaysthe median and the ‘X’ the mean. The left and right whiskers display the first (Q1)and fourth (Q4) quartile range respectively. The left and right boxes display the second(Q2) and third (Q3) quartile range respectively
图525段训练视频与8段测试视频(不含“患者体外操作”类别)的时长分布箱线图 图中水平中线代表中位数,“X”代表平均值;左侧须与右侧须分别代表第一四分位数(Q1)和第四四分位数(Q4)的范围;左侧箱体与右侧箱体分别代表第二四分位数(Q2)和第三四分位数(Q3)的范围。
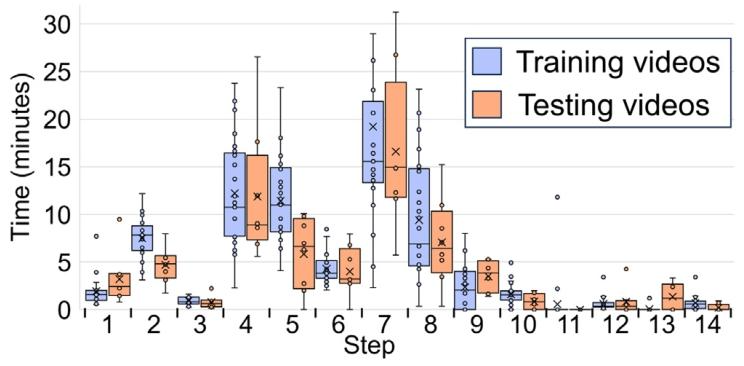
Fig. 6. Length distribution of steps across the 25-training and 8-testing videos displayedas a box-whisker diagram. The middle horizontal line displays the median and the ‘X’the mean. The left and right whiskers display the first (Q1) and fourth (Q4) quartilerange respectively. The left and right boxes display the second (Q2) and third (Q3)quartile range respectively. The ‘∙’ display each individual step length in the dataset.
图6 25段训练视频与8段测试视频中各手术步骤的时长分布箱线图 图中水平中线代表中位数,“X”代表平均值;左侧须与右侧须分别代表第一四分位数(Q1)和第四四分位数(Q4)的范围;左侧箱体与右侧箱体分别代表第二四分位数(Q2)和第三四分位数(Q3)的范围;“∙”代表数据集中每个手术步骤的具体时长。
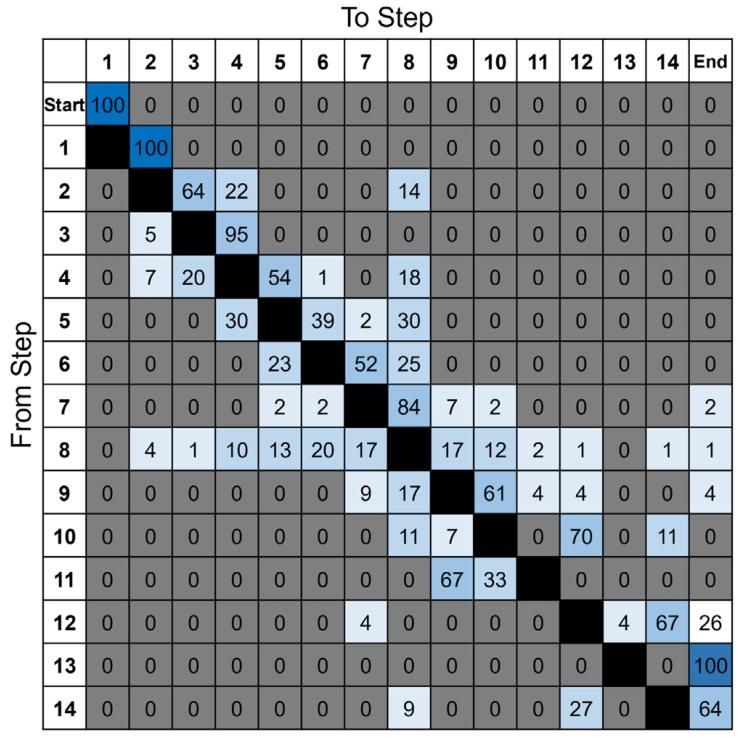
Fig. 7. Transition probabilities across the 25-training-videos. Each value represents the probability of going from one step to another (e.g. step-4 goes to step-5 with 54%probability). The ‘out of patient’ class was removed for these calculations. The greyed out 0 values are true zero and not rounded. The darker the blue colour the larger thetransition probability, up to 100%
图7 25段训练视频中各手术步骤的转移概率 每个数值代表从一个步骤过渡到另一个步骤的概率(例如,从步骤4过渡到步骤5的概率为54%)。计算时已剔除“患者体外操作”类别。灰色标注的0值为真实零值,非四舍五入结果。蓝色越深,代表转移概率越大,最大值为100%。
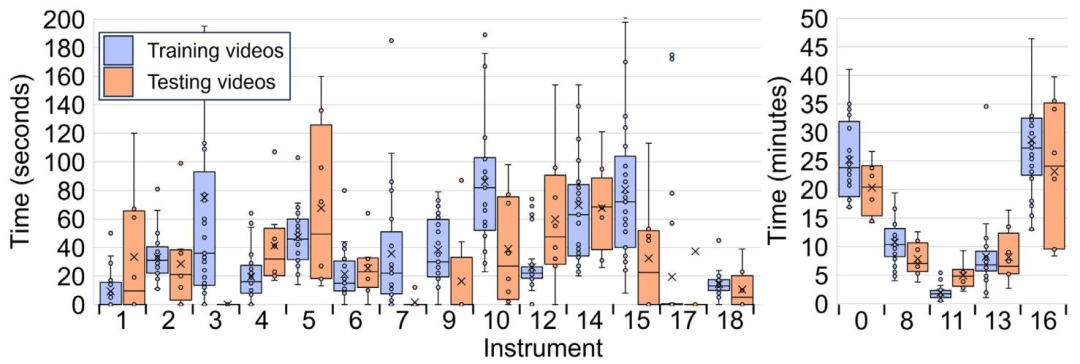
Fig. 8. Length distribution of instruments across the 25-training and 8-testing videos displayed as a box-whisker diagram. The time axis is presented as seconds in the left diagramand minutes in the right diagram — this is for improved visibility, as otherwise the minor class instrument length distributions would not be visible. The middle horizontal linedisplays the median and the ‘X’ the mean. The left and right whiskers display the first (Q1) and fourth (Q4) quartile range respectively. The left and right boxes display the second(Q2) and third (Q3) quartile range respectively. The ‘∙’ display each individual instrument length in the dataset
图8 25段训练视频与8段测试视频中各手术器械的时长分布箱线图 左侧图表的时间轴单位为秒,右侧图表的时间轴单位为分钟——采用双单位展示是为提升可视化效果,若仅用单一单位,少数类别器械的时长分布将难以清晰呈现。 图中水平中线代表中位数,“X”代表平均值;左侧须与右侧须分别代表第一四分位数(Q1)和第四四分位数(Q4)的范围;左侧箱体与右侧箱体分别代表第二四分位数(Q2)和第三四分位数(Q3)的范围;“∙”代表数据集中每个手术器械的具体时长。
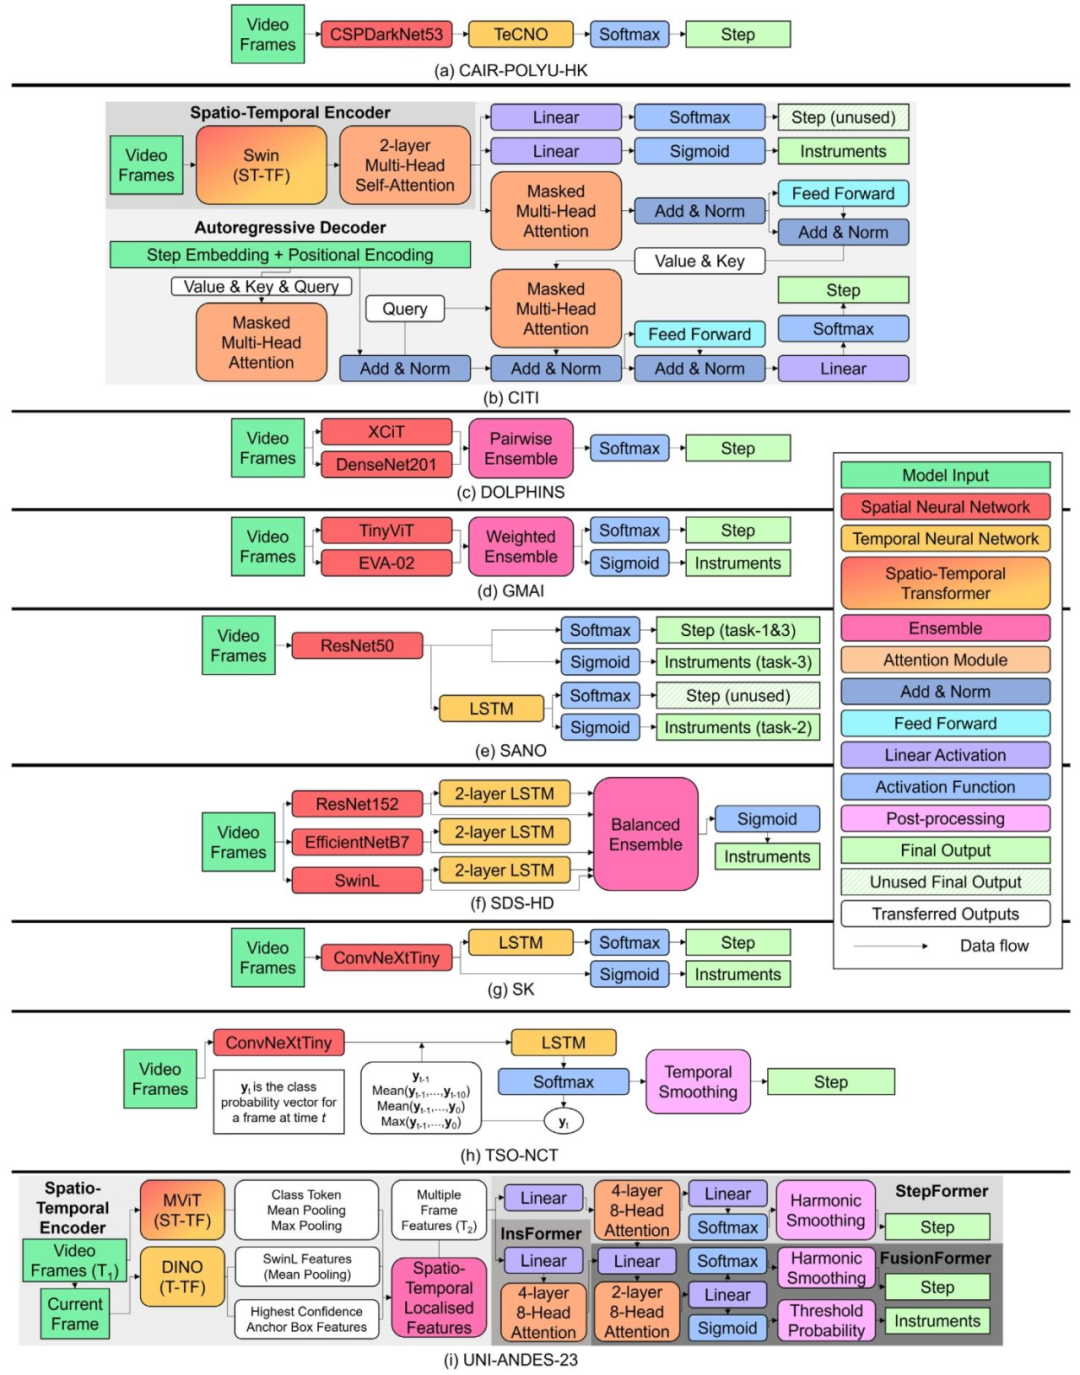
Fig. 9. Detailed model architectures for the 9-models. Each model architecture is given as a series of model modules, with the legend on the right identifying the colour used torepresent each module, and the arrows’ direction illustrating the flow of features extracted from the data (generally left to right). The various grey background for models (b) and(i) are there to visually indicate the different transformer components (e.g. the spatio-temporal encoder component). Simplified model architectures are displayed in Table 2.
图9 9个参赛模型的详细架构图 每个模型架构均以一系列模型模块的形式呈现;右侧图例标注了代表各模块的对应颜色,箭头方向则展示了从数据中提取特征的流动方向(通常为从左至右)。模型(b)与模型(i)采用不同的灰色背景,旨在通过视觉区分突出其内部不同的Transformer组件(例如时空编码器组件)。各模型的简化架构图详见表2。
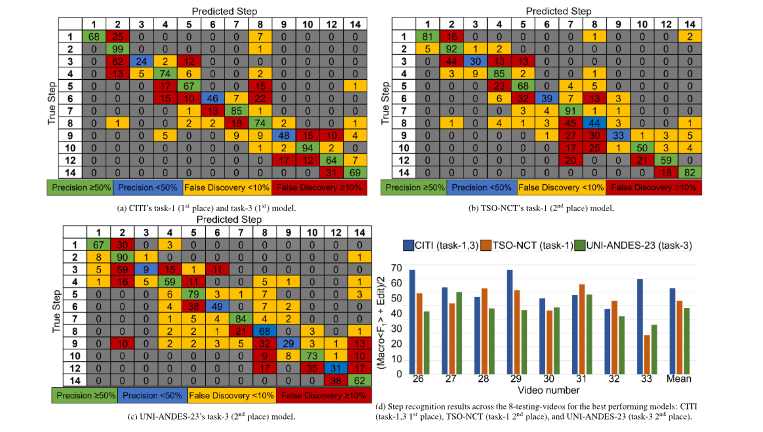
Fig. 10. In-depth details of the top models in step recognition across the 8-testing-videos: (a–c) Confusion matrices, mean-averaged and rounded to 0 decimal places. Each cell(𝑖, 𝑗) represents the number of instances from true class 𝑖 that were predicted as class 𝑗. The diagonal entries indicate correct classifications, while off-diagonal entries showmisclassifications. (d) Per-video performance on the step recognition metric (Eq. (5))
图10 8段测试视频中步骤识别任务顶尖模型的深度细节展示 (a–c)混淆矩阵:结果经平均计算后保留整数(0位小数)。矩阵中每个单元格(𝑖, 𝑗)代表真实类别为𝑖的样本被预测为类别𝑗的数量;对角线上的数值表示正确分类的样本数,非对角线上的数值则表示错误分类的样本数。 (d)各视频的步骤识别性能:以公式(5)中的评估指标为依据,展示每段测试视频对应的模型识别性能结果。
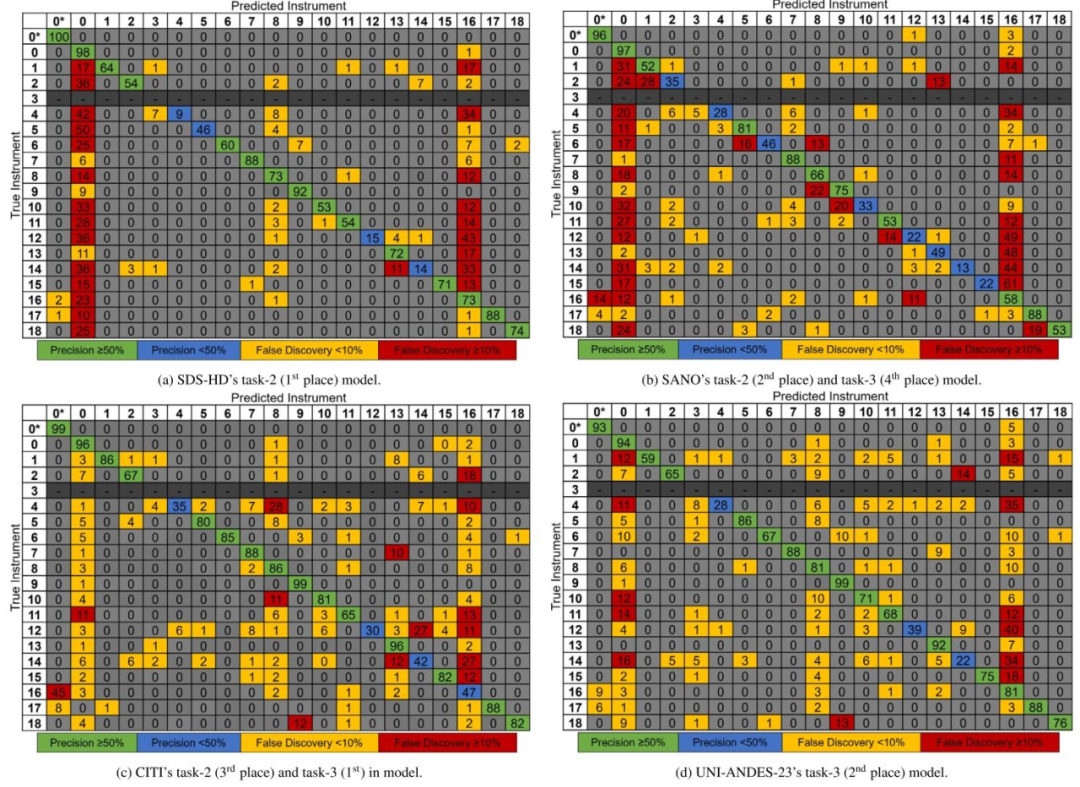
Fig. 11. Instrument confusion matrices for the top models mean-averaged across the 8-testing-videos and rounded to 0 decimal places. Each cell (𝑖, 𝑗) represents the number ofinstances from true class 𝑖 that were predicted as class 𝑗. The diagonal entries indicate correct classifications, while off-diagonal entries show misclassifications. 0* indicates ‘no
secondary instrument’. Instrument-3 (cup forceps) is not present in the testing dataset and so greyed out
图118段测试视频中器械识别任务顶尖模型的混淆矩阵(结果经平均计算后保留整数,0位小数) 矩阵中每个单元格(𝑖, 𝑗)代表真实类别为𝑖的样本被预测为类别𝑗的数量;对角线上的数值表示正确分类的样本数,非对角线上的数值则表示错误分类的样本数。 其中,“0*”代表“无次要器械(no secondary instrument)”;器械3(杯状镊子,cup forceps)未出现在测试数据集中,因此相关区域以灰色标注。
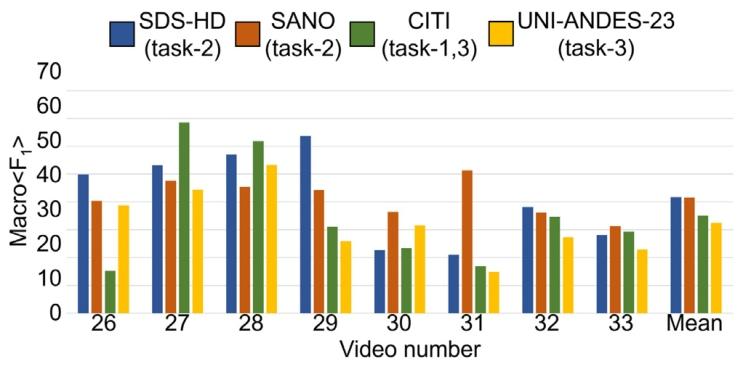
Fig. 12. Instrument recognition results across the 8-testing-videos for the best performing models: SDS-HD (task-2 1st place), SANO (task-2 2nd place), CITI (task-3 1st place),UNI-ANDES-23 (task-3 2nd place) . Per-video performance is given on the instrumentrecognition metric (Eq. (6)).
图12 8段测试视频中顶尖模型的器械识别结果 展示模型包括:SDS-HD(任务2第1名)、SANO(任务2第2名)、CITI(任务3第1名)、UNI-ANDES-23(任务3第2名)。 图中以“器械识别指标(公式6,Eq. (6))”为基准,呈现了各模型在每段测试视频中的具体性能表现。
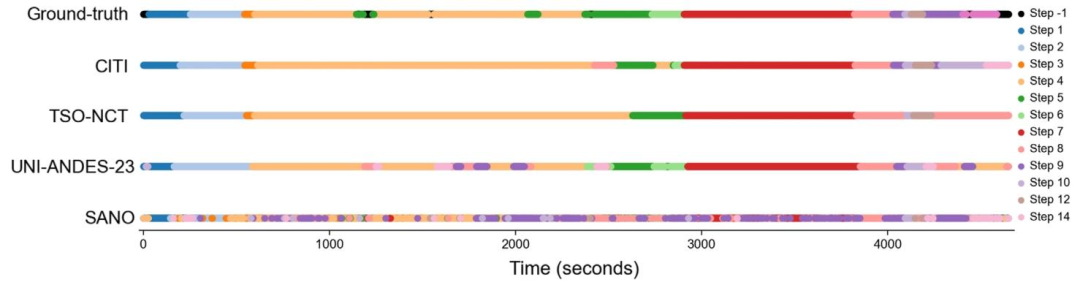
Fig. 13. Timeline of the ground-truth step classifications against the model predictions for video-26 in the testing dataset. The models are: CITI (task-1 1st place & task-3 1stplace), TSO-NCT (task-1 2nd place), UNI-ANDES-23 (task-3 2nd place), SANO (task-3 4th place). Note the step ‘-1’ annotations in the ground truth representing ‘out of frame’ wereremoved during evaluation.
图13测试数据集第26段视频(video-26)中,手术步骤的真实标注(ground-truth)与模型预测结果的时间轴对比 展示的模型包括: - CITI(任务1第1名、任务3第1名) - TSO-NCT(任务1第2名) - UNI-ANDES-23(任务3第2名) - SANO(任务3第4名) 注:真实标注中代表“目标出框(out of frame)”的步骤标注“-1”,在评估过程中已被剔除,因此未在时间轴中呈现。
Table
表
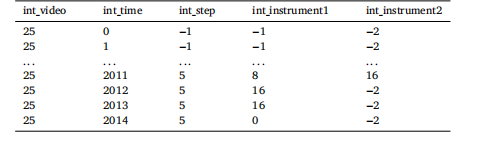
Table 1An example of the .csv annotations given to participants. ‘int_video’ represents whichvideo number the annotations are referring to. ‘int_time’ represents the frame numberthat row’s annotations is representing. The numbers in the ‘int_step’, ‘int_instrument1’,and ‘int_instrument2’ columns represent the respective step and instrument class,as defined in Figs. 3 and 4. A ‘−1’ in the ‘int_step’ and ‘int_instrument1’ columnis indicative of ‘out_of_frame’, and removed for evaluation purposes. A ‘−2’ in the‘int_instrument2’ column is indicative of ‘no annotation’, and present as to not havean empty value. Note ‘...’ indicates a break in the annotations for demonstrationpurposes.
表1 提供给参赛者的.csv格式标注示例 “int_video”代表该标注所对应的视频编号;“int_time”代表该行标注所对应的帧编号;“int_step”“int_instrument1”“int_instrument2”列中的数字分别代表相应的手术步骤类别与器械类别(具体定义参见图3和图4)。 “int_step”与“int_instrument1”列中的“−1”表示“目标出框(out_of_frame)”,在评估时会被剔除;“int_instrument2”列中的“−2”表示“无标注(no annotation)”,设置该值是为避免出现空值。
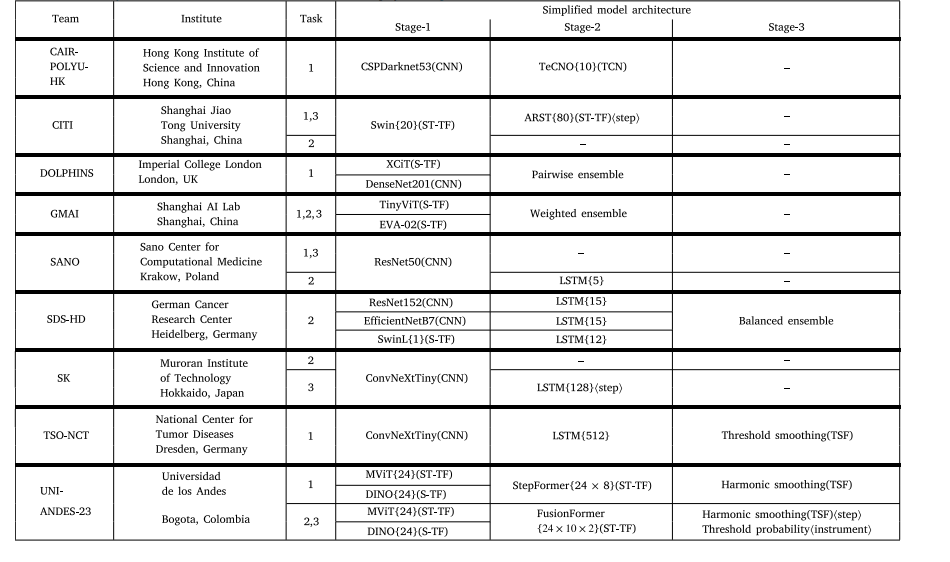
Table 2Team details (9-teams) and simplified model architectures for the successful 18-submissions. For the model columns, each row represents a different training component, and if ahorizontal line is removed at a later stage it means the model features have been combined (e.g. in an Ensemble). () are given to indicate the type of model used for that stage.{} are given to indicate the window size of a temporal neural network (e.g. {24} represents 24-images have been turned into a sequence as an input). ⟨⟩ are given to indicatethe task (step or instrument) for multi-task recognition if the same architecture is not used for both tasks. Citations: ARST (Zou et al., 2022); CSPDarknet53 (Bochkovskiy et al.,2020); ConvNeXtTiny (Liu et al., 2022); DenseNet201 (Huang et al., 2016), DINO (Zhang et al., 2022); EfficientNetB7 (Tan and Le, 2019); EVA-02 (Fang et al., 2024); MViT (Fanet al., 2021); ResNet152, ResNet50 (He et al., 2016); Swin, SwinL (Liu et al., 2021); TeCNO (Czempiel et al., 2020), TinyViT (Wu et al., 2022), Threshold Smoothing (Das et al.,2022), XCiT (El-Nouby et al., 2021). Detailed model architectures are displayed in Fig. 9.
表2 9支参赛团队详情及18份有效参赛方案的简化模型架构 在“模型”相关列中,每一行代表一个独立的训练组件;若某一组件后续无横线连接,表明该组件的特征已与其他组件融合(例如在集成模型(Ensemble)中)。 - 圆括号“()”用于标注对应阶段所使用的模型类型; - 花括号“{}”用于标注时序神经网络的窗口大小(例如“{24}”表示将24帧图像组成一个序列作为输入); - 尖括号“⟨⟩”用于标注多任务识别中不同任务(步骤识别或器械识别)的专属架构(若两任务未采用同一架构)。 参考文献说明: ARST(Zou 等人,2022);CSPDarknet53(Bochkovskiy 等人,2020);ConvNeXtTiny(Liu 等人,2022);DenseNet201(Huang 等人,2016);DINO(Zhang 等人,2022);EfficientNetB7(Tan 与 Le,2019);EVA-02(Fang 等人,2024);MViT(Fan 等人,2021);ResNet152、ResNet50(He 等人,2016);Swin、SwinL(Liu 等人,2021);TeCNO(Czempiel 等人,2020);TinyViT(Wu 等人,2022);阈值平滑(Threshold Smoothing)(Das 等人,2022);XCiT(El-Nouby 等人,2021)。 各模型的详细架构图见图9。
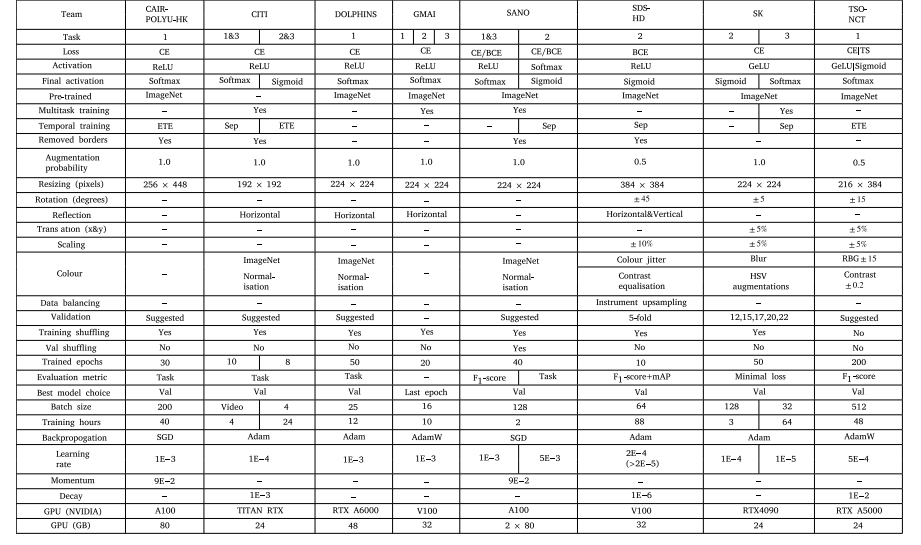
Table 3Training parameters and augmentations utilised by the models excluding UNI-ANDES-23. ‘∕’ implies implementation details for steps or instruments (e.g. CE/BCE means CE usedfor steps and BCE used for instruments). ‘|’ implies implementation details from stage-1 to stage-2 (e.g. GeLU|Sigmoid means GeLU used for stage-1 and Sigmoid used for stage-2).Abbreviations: Adam (Adaptive Moment Estimation), AdamW (Adam with weight decay), BCE (Binary Cross-Entropy Loss Function), CE (Cross-Entropy Loss Function), ETE (EndTo End Temporal Training), GeLU (Gaussian error Linear Unit), HSV (Hue Saturation Value), mAP (mean Average Precision), RBG (Red Blue Green), ReLU (Rectified Linear Unit),SGD (Stochastic Gradient Descent), TS (Temporal Smoothing Loss Function), Sep (Separate Temporal Training), Val (Validation Dataset)
表3 除UNI-ANDES-23团队外,其他模型所采用的训练参数与数据增强策略 符号说明: - “∕”用于区分步骤识别与器械识别任务的实现细节(例如“CE/BCE”表示步骤识别使用交叉熵损失函数(CE),器械识别使用二元交叉熵损失函数(BCE)); - “|”用于区分模型不同阶段(阶段1至阶段2)的实现细节(例如“GeLU|Sigmoid”表示阶段1使用高斯误差线性单元(GeLU),阶段2使用Sigmoid激活函数)。 缩写说明: Adam(自适应矩估计优化器)、AdamW(带权重衰减的Adam优化器)、BCE(二元交叉熵损失函数)、CE(交叉熵损失函数)、ETE(端到端时序训练)、GeLU(高斯误差线性单元激活函数)、HSV(色调-饱和度-明度,用于图像颜色空间调整)、mAP(平均精度均值,评估指标)、RGB(红-绿-蓝,图像颜色通道)、ReLU(整流线性单元激活函数)、SGD(随机梯度下降优化器)、TS(时序平滑损失函数)、Sep(分离时序训练)、Val(验证数据集)。
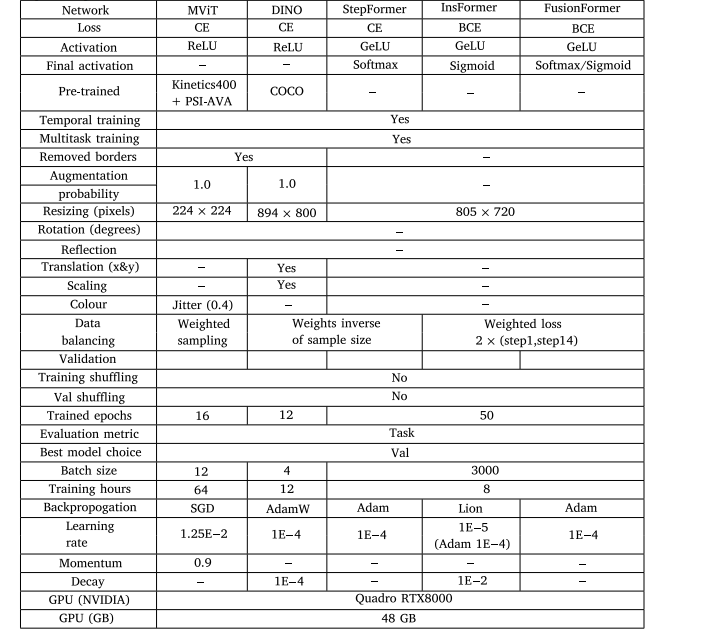
Table 4Training parameters and augmentations utilised by UNI-ANDES-23. Abbreviations: Adam (Adaptive Moment Estimation), AdamW (Adam withweight decay), BCE (Binary Cross-Entropy Loss Function), CE (Cross-Entropy Loss Function), GeLU (Gaussian error Linear Unit), Lion (LightweightInterpolated Optimiser), ReLU (Rectified Linear Unit), SGD (Stochastic Gradient Descent), Val (Validation Dataset).
表 4 UNI-ANDES-23 团队所采用的训练参数与数据增强策略(缩写说明:Adam(自适应矩估计优化器)、AdamW(带权重衰减的 Adam 优化器)、BCE(二元交叉熵损失函数)、CE(交叉熵损失函数)、GeLU(高斯误差线性单元激活函数)、Lion(轻量级插值优化器)、ReLU(整流线性单元激活函数)、SGD(随机梯度下降优化器)、Val(验证数据集))
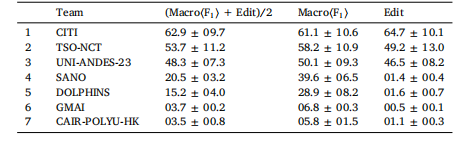
Table 512-steps multi-class online recognition (task-1) rankings. Metrics are calculated acrossthe 8-testing-videos, and given as percentages to one decimal place (mean ± std)
表 5 12 个手术步骤的多类别在线识别(任务 1)排名
所有指标均基于 8 段测试视频计算得出,结果以百分比形式呈现(保留一位小数),格式为 “平均值 ± 标准差(mean ± std)”。
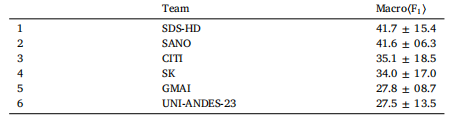
Table 619-instruments multi-label online recognition (task-2) rankings. Metrics are calculated across the 8-testing-videos, and given as percentages to one decimal place(mean ± std).
表 6 19 种手术器械的多标签在线识别(任务 2)排名
所有指标均基于 8 段测试视频计算得出,结果以百分比形式呈现(保留一位小数),格式为 “平均值 ± 标准差(mean ± std)”。
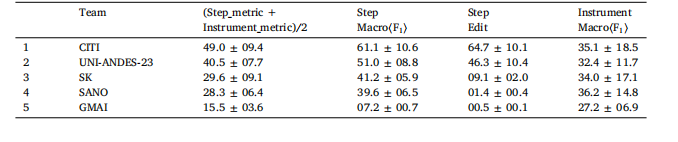
Table 712-steps and 19-instruments multi-task online recognition (task-3) rankings. Metrics are calculated across the 8-testing-videos,and given as percentages to one decimal place (mean ± std). The full definition of the multi-task metric is displayed in Eq.(7).
表7 12个手术步骤与19种手术器械的多任务在线识别(任务3)排名 所有指标均基于8段测试视频计算得出,结果以百分比形式呈现(保留一位小数),格式为“平均值±标准差(mean ± std)”。多任务识别的完整指标定义详见公式(7)(Eq. (7))。
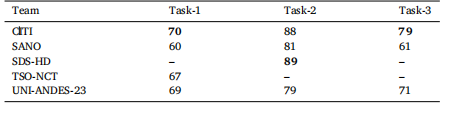
Table 8Benchmark metric results for the suggested validation dataset, videos: 01, 12, 21,24, 25. Bold indicates the best result for that column’s task. Results are meanaveraged across the 5-videos and given to 0 decimal places. All teams used thesuggested validation dataset split, and so models are optimised for these 5-videos. Therespective metrics for task-1, task-2, and task-3 are defined in Eqs. (5), (6), and (7)respectively
表8 推荐验证数据集(视频编号:01、12、21、24、25)的基准指标结果 表格中加粗数值代表对应列任务(任务1、任务2、任务3)的最优结果。所有结果均基于5段验证视频的平均计算得出,保留整数(0位小数)。 所有参赛团队均采用了推荐的验证数据集划分方式,因此各模型均针对这5段验证视频进行了优化调整。其中,任务1、任务2、任务3的对应评估指标分别定义于公式(5)(Eq. (5))、公式(6)(Eq. (6))与公式(7)(Eq. (7))。