Python生成物理引擎的简单知识图谱
from IPython.display import HTML
from pyvis.network import Network
import networkx as nx
import os# 修复模板路径问题
from pyvis import network as net_module
os.environ["PATH"] += os.pathsep + os.path.dirname(net_module.__file__)# 创建有向图对象
g = nx.DiGraph()# 添加节点(带分类)
nodes = [("2008 Beijing Olympics", "Event"),("IOC", "Organization"),("Beijing", "City"),("China", "Country"),("He Zhenliang", "Person"),("Samaranch", "Person"),("Three Concepts", "Slogan"),("Moscow Vote", "Event"),("Competitor Cities", "Group"),("Olympic Green", "Venue"),("SARS Prevention", "Measure")
]for node, group in nodes:g.add_node(node, group=group, title=node)# 添加边(关系)
edges = [("Beijing", "2008 Beijing Olympics", "Hosts"),("China", "Beijing", "Capital of"),("IOC", "Beijing", "Selected by"),("He Zhenliang", "Beijing", "Advocated for"),("Samaranch", "Beijing", "Announced selection"),("Three Concepts", "Beijing", "Bid theme"),("Moscow Vote", "Beijing", "Winning venue"),("Competitor Cities", "Beijing", "Defeated"),("Olympic Green", "Beijing", "Constructed for"),("SARS Prevention", "Beijing", "Implemented")
]for src, dst, rel in edges:g.add_edge(src, dst, title=rel)# 配置可视化参数(关键修复:添加notebook=True)
net = Network(height="750px",width="100%",bgcolor="white",font_color="black",notebook=True  # 修复Jupyter环境检测
)# 设置节点样式
node_scale = 1.5
groups = {"Event": {"color": "#FF6F61", "size": 25*node_scale},"Organization": {"color": "#6B5B95", "size": 20*node_scale},"City": {"color": "#88B04B", "size": 35*node_scale},"Country": {"color": "#92A8D1", "size": 30*node_scale},"Person": {"color": "#955251", "size": 20*node_scale},"Slogan": {"color": "#B565A7", "size": 18*node_scale},"Group": {"color": "#009B77", "size": 22*node_scale},"Venue": {"color": "#DD4124", "size": 20*node_scale},"Measure": {"color": "#D65076", "size": 20*node_scale}
}# 将网络x数据导入pyvis
net.from_nx(g)# 配置物理布局
net.toggle_physics(True)
net.set_options("""
{"physics": {"barnesHut": {"gravitationalConstant": -5000,"centralGravity": 0.3,"springLength": 200,"springConstant": 0.04,"damping": 0.09,"avoidOverlap": 0.5},"maxVelocity": 50,"minVelocity": 0.1}
}
""")# 设置节点样式
for node in net.nodes:group = node["group"]node.update(groups[group])# 生成可视化文件(使用绝对路径)
output_path = os.path.abspath("beijing_olympics.html")
net.show(output_path)# 在Jupyter中内联显示
try:HTML(filename=output_path)
except:print(f"可视化文件已生成到:{output_path}")print("请在浏览器中打开该文件查看结果")
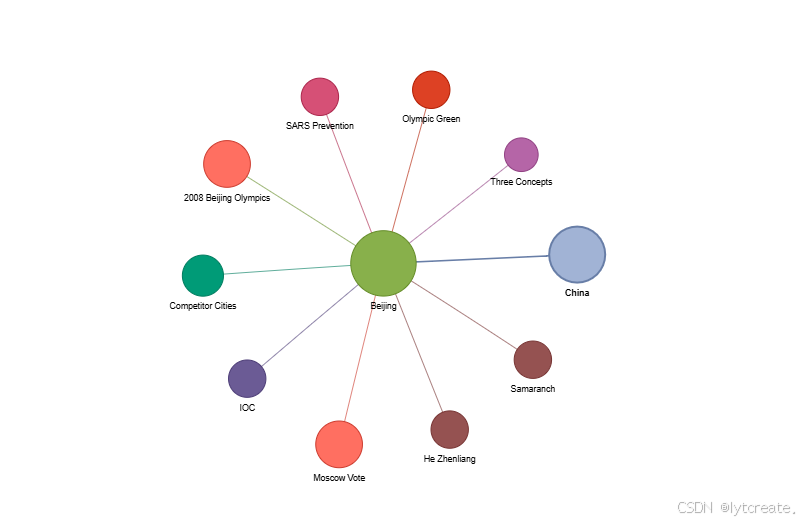
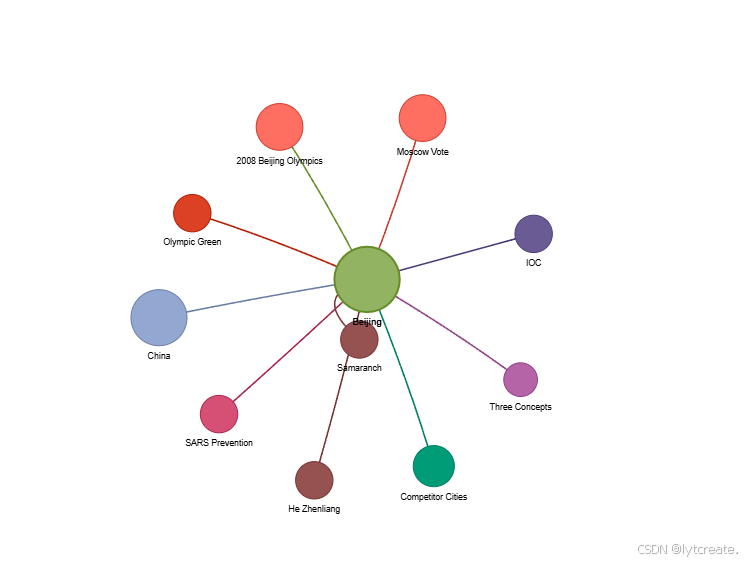
生成的html文件打开后有物理引擎,可以拉伸,旋转,会缠绕,效果如下: