二次函数图像动画展示
1.功能说明
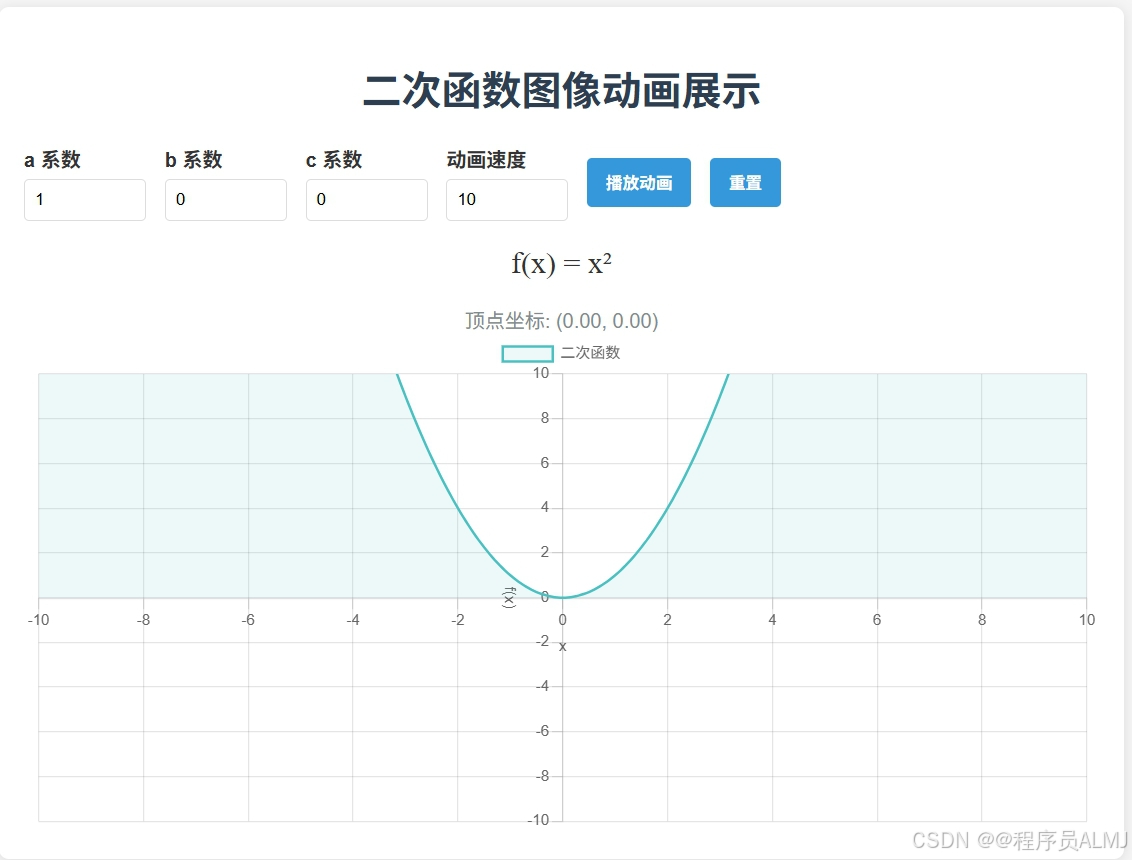
这个HTML页面具有以下功能:
交互式参数控制:
可以调整二次函数的三个系数a、b、c
可以调整动画速度
动画效果:
点击"播放动画"按钮,函数图像会从当前状态平滑过渡到新的参数设置
动画速度可调
数学信息显示:
实时显示二次函数的数学表达式
计算并显示顶点坐标
可视化图表:
使用Chart.js库绘制函数图像
坐标轴清晰标注
图像平滑连接
2.使用方法
将上述代码复制到一个文本文件中,保存为
.html后缀用浏览器打开该文件
调整参数后点击"播放动画"按钮观察函数图像变化
点击"重置"按钮恢复默认设置
3.代码
<!DOCTYPE html>
<html lang="zh-CN">
<head><meta charset="UTF-8"><meta name="viewport" content="width=device-width, initial-scale=1.0"><title>二次函数图像动画展示</title><script src="https://cdn.jsdelivr.net/npm/chart.js"></script><style>body {font-family: 'Arial', sans-serif;max-width: 900px;margin: 0 auto;padding: 20px;background-color: #f5f5f5;color: #333;}h1 {color: #2c3e50;text-align: center;}.container {background-color: white;border-radius: 8px;padding: 20px;box-shadow: 0 2px 10px rgba(0,0,0,0.1);margin-bottom: 20px;}.controls {display: flex;flex-wrap: wrap;gap: 15px;margin-bottom: 20px;align-items: center;}.control-group {display: flex;flex-direction: column;}label {margin-bottom: 5px;font-weight: bold;}input {padding: 8px;border: 1px solid #ddd;border-radius: 4px;width: 80px;}button {background-color: #3498db;color: white;border: none;padding: 10px 15px;border-radius: 4px;cursor: pointer;font-weight: bold;transition: background-color 0.3s;}button:hover {background-color: #2980b9;}.chart-container {position: relative;height: 400px;width: 100%;}.function-display {text-align: center;font-size: 24px;margin: 20px 0;font-family: 'Times New Roman', serif;}.vertex-info {text-align: center;font-size: 16px;margin-top: 10px;color: #7f8c8d;}</style>
</head>
<body><div class="container"><h1>二次函数图像动画展示</h1><div class="controls"><div class="control-group"><label for="a">a 系数</label><input type="number" id="a" step="0.1" value="1"></div><div class="control-group"><label for="b">b 系数</label><input type="number" id="b" step="0.1" value="0"></div><div class="control-group"><label for="c">c 系数</label><input type="number" id="c" step="0.1" value="0"></div><div class="control-group"><label for="speed">动画速度</label><input type="number" id="speed" min="1" max="10" value="5"></div><button id="animateBtn">播放动画</button><button id="resetBtn">重置</button></div><div class="function-display" id="functionDisplay">f(x) = x²</div><div class="vertex-info" id="vertexInfo">顶点坐标: (0, 0)</div><div class="chart-container"><canvas id="quadraticChart"></canvas></div></div><script>// 获取DOM元素const aInput = document.getElementById('a');const bInput = document.getElementById('b');const cInput = document.getElementById('c');const speedInput = document.getElementById('speed');const animateBtn = document.getElementById('animateBtn');const resetBtn = document.getElementById('resetBtn');const functionDisplay = document.getElementById('functionDisplay');const vertexInfo = document.getElementById('vertexInfo');const ctx = document.getElementById('quadraticChart').getContext('2d');// 初始化图表let chart = new Chart(ctx, {type: 'line',data: {datasets: [{label: '二次函数',borderColor: 'rgb(75, 192, 192)',backgroundColor: 'rgba(75, 192, 192, 0.1)',borderWidth: 2,pointRadius: 0,fill: true,tension: 0.1}]},options: {responsive: true,maintainAspectRatio: false,scales: {x: {type: 'linear',position: 'center',title: {display: true,text: 'x'},min: -10,max: 10},y: {type: 'linear',position: 'center',title: {display: true,text: 'f(x)'},min: -10,max: 10}},animation: {duration: 0}}});// 计算二次函数值function quadraticFunction(x, a, b, c) {return a * x * x + b * x + c;}// 更新函数显示function updateFunctionDisplay(a, b, c) {let display = 'f(x) = ';if (a !== 0) {if (a === 1) display += 'x²';else if (a === -1) display += '-x²';else display += a + 'x²';}if (b !== 0) {if (b > 0 && a !== 0) display += ' + ';else if (b < 0) display += ' - ';if (Math.abs(b) !== 1 || a === 0) display += Math.abs(b);display += 'x';}if (c !== 0) {if (c > 0 && (a !== 0 || b !== 0)) display += ' + ';else if (c < 0) display += ' - ';display += Math.abs(c);}// 如果没有显示任何项,说明所有系数都是0if (display === 'f(x) = ') display = 'f(x) = 0';functionDisplay.textContent = display;}// 计算并显示顶点坐标function updateVertexInfo(a, b, c) {if (a === 0) {vertexInfo.textContent = "a=0时不是二次函数";return;}const h = -b / (2 * a);const k = c - (b * b) / (4 * a);vertexInfo.textContent = `顶点坐标: (${h.toFixed(2)}, ${k.toFixed(2)})`;}// 生成数据点function generateData(a, b, c) {const data = [];for (let x = -10; x <= 10; x += 0.1) {data.push({x: x,y: quadraticFunction(x, a, b, c)});}return data;}// 更新图表数据function updateChart(a, b, c) {chart.data.datasets[0].data = generateData(a, b, c);chart.update();updateFunctionDisplay(a, b, c);updateVertexInfo(a, b, c);}// 动画函数function animateToTarget(targetA, targetB, targetC, speed) {const currentA = parseFloat(aInput.value);const currentB = parseFloat(bInput.value);const currentC = parseFloat(cInput.value);const stepA = (targetA - currentA) / (20 / speed);const stepB = (targetB - currentB) / (20 / speed);const stepC = (targetC - currentC) / (20 / speed);let currentStep = 0;const totalSteps = 20;const animation = setInterval(() => {if (currentStep >= totalSteps) {clearInterval(animation);aInput.value = targetA;bInput.value = targetB;cInput.value = targetC;updateChart(targetA, targetB, targetC);animateBtn.disabled = false;return;}const newA = currentA + stepA * currentStep;const newB = currentB + stepB * currentStep;const newC = currentC + stepC * currentStep;updateChart(newA, newB, newC);currentStep++;}, 50);}// 事件监听animateBtn.addEventListener('click', () => {const targetA = parseFloat(document.getElementById('a').value);const targetB = parseFloat(document.getElementById('b').value);const targetC = parseFloat(document.getElementById('c').value);const speed = parseInt(document.getElementById('speed').value);animateBtn.disabled = true;animateToTarget(targetA, targetB, targetC, speed);});resetBtn.addEventListener('click', () => {aInput.value = 1;bInput.value = 0;cInput.value = 0;updateChart(1, 0, 0);});// 输入变化时更新图表(无动画)[aInput, bInput, cInput].forEach(input => {input.addEventListener('change', () => {const a = parseFloat(aInput.value);const b = parseFloat(bInput.value);const c = parseFloat(cInput.value);updateChart(a, b, c);});});// 初始化图表updateChart(1, 0, 0);</script>
</body>
</html>