【echarts】分割环形图组件
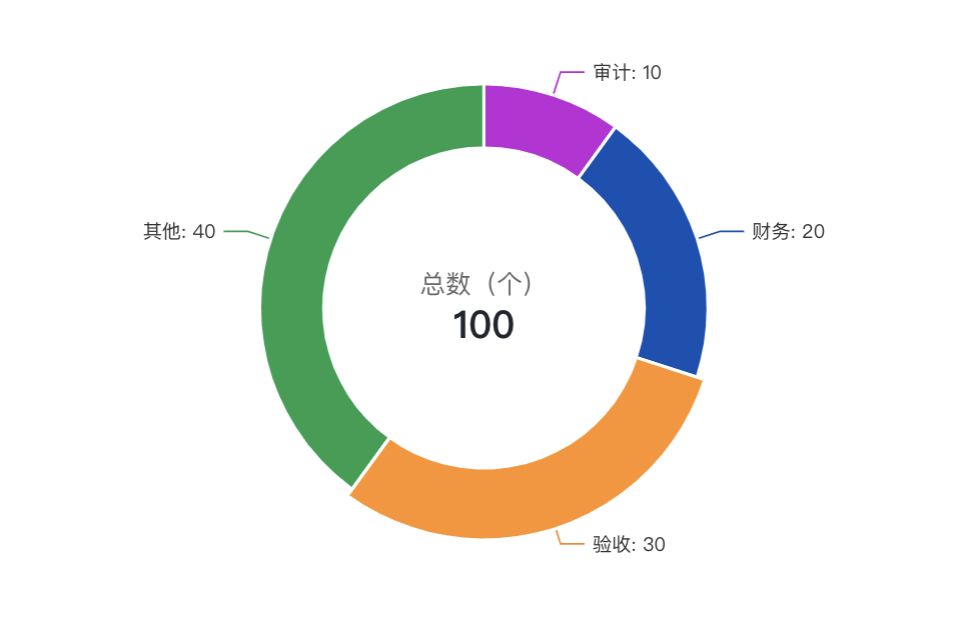
这个组件实现了一个环形饼图,支持以下功能:
- 自定义颜色、间隙和中心位置
- 支持在图表中心显示总计文本
- 可以自定义中心文本的样式
- 响应式设计,支持自定义宽度和高度
- 数据变化时自动更新图表
使用时,只需传入 chartData 数据和其他可选配置项即可。
组件代码
<template><div :id="chartId" :style="{ width: width, height: height }"></div>
</template><script setup>
import * as echarts from "echarts";
import { onMounted, onUnmounted, ref, watch } from "vue";const props = defineProps({chartData: {type: Array,required: true,default: () => [],},width: {type: String,default: "100%",},height: {type: String,default: "400px",},chartOptions: {type: Object,default: () => ({}),},sectorGap: {type: Number,default: 2,},gapColor: {type: String,default: "#fff",},chartCenter: {type: Array,default: () => ["50%", "50%"],},colors: {type: Array,default: () => ["#C114D8","#0D4EB5","#FF8620","#119F4D","#3E17E9","#DFA00D","#fb8166","#e062ae","#7262bd","#61a0a8","#bda29a","#444693",],},showCenterText: {type: Boolean,default: true,},// 第一行文本配置centerTitle: {type: String,default: "总数(个)",},centerTitleStyle: {type: Object,default: () => ({fontSize: 16,color: "#666",}),},// 第二行文本配置centerValueStyle: {type: Object,default: () => ({fontSize: 24,fontWeight: "bold",color: "#21252E",}),},
});const chartId = ref(`ring-pie-chart-${Date.now()}`);
let chartInstance = null;// 计算数据总和
const calculateTotal = (data) => {return data.reduce((sum, item) => sum + (item.value || 0), 0);
};const initChart = () => {const chartDom = document.getElementById(chartId.value);chartInstance = echarts.init(chartDom);const formattedData = props.chartData.map((item, index) => ({...item,itemStyle: {color: props.colors[index % props.colors.length],},}));const total = calculateTotal(props.chartData);const series = [{type: "pie",radius: ["50%", "70%"],center: props.chartCenter,data: formattedData,label: {show: true,position: "outside",formatter: "{b}: {c}",},labelLine: {show: true,},itemStyle: {borderWidth: props.sectorGap,borderColor: props.gapColor,},},];// 添加中央文本if (props.showCenterText) {series.push({type: "gauge",startAngle: 90,endAngle: -270,radius: "40%",center: props.chartCenter,pointer: {show: false,},axisLine: {show: false,},axisTick: {show: false,},splitLine: {show: false,},axisLabel: {show: false,},detail: {show: true,formatter: `{title|${props.centerTitle}}\n{value|${total} }`,backgroundColor: "transparent",borderWidth: 0,borderRadius: 4,offsetCenter: [0, 0],rich: {title: {fontSize: props.centerTitleStyle.fontSize,color: props.centerTitleStyle.color,lineHeight: 20,},value: {fontSize: props.centerValueStyle.fontSize,fontWeight: props.centerValueStyle.fontWeight,color: props.centerValueStyle.color,lineHeight: 30,},},},data: [{ value: 0 }],});}const defaultOptions = {color: props.colors,series,};const mergedOptions = {...defaultOptions,...props.chartOptions,series: [...defaultOptions.series.slice(0, 1),...(props.chartOptions.series || []),...defaultOptions.series.slice(1),],};chartInstance.setOption(mergedOptions);
};watch(() => [props.chartData,props.sectorGap,props.gapColor,props.chartCenter,props.colors,props.showCenterText,props.centerTitle,],() => {if (chartInstance) {const formattedData = props.chartData.map((item, index) => ({...item,itemStyle: {color: props.colors[index % props.colors.length],},}));const total = calculateTotal(props.chartData);const seriesOptions = [{data: formattedData,center: props.chartCenter,itemStyle: {borderWidth: props.sectorGap,borderColor: props.gapColor,},},];if (props.showCenterText) {seriesOptions.push({type: "gauge",detail: {formatter: `{title|${props.centerTitle}}\n{value|${total}}`,},});}chartInstance.setOption({color: props.colors,series: seriesOptions,});}},{ deep: true }
);onMounted(() => {initChart();
});onUnmounted(() => {if (chartInstance) {chartInstance.dispose();chartInstance = null;}
});
</script><style scoped>
div {width: 100%;height: 100%;
}
</style>
组件调用
<pieChart :chartData="data" />data=[{name:'其他',value:'20'
},{name:'财务',value:'20'
},{name:'审计',value:'20'
}]