基于 HTML、CSS 和 JavaScript 的智能图像灰度直方图分析系统
目录
1 前言
2 技术实现
2.1 HTML 结构:搭建模块化页面骨架
2.1.1 核心组件设计
2.1.2 完整 HTML 代码
2.1.3 结构设计思路
2.2 CSS 样式:打造科技感与易用性兼顾的视觉体验
2.2.1 核心样式逻辑
2.2.2 完整 CSS 代码
2.2.3 样式设计亮点
2.3 JavaScript 交互:实现核心功能逻辑
2.3.1 初始化与事件绑定
2.3.2 核心函数解析
3 完整代码
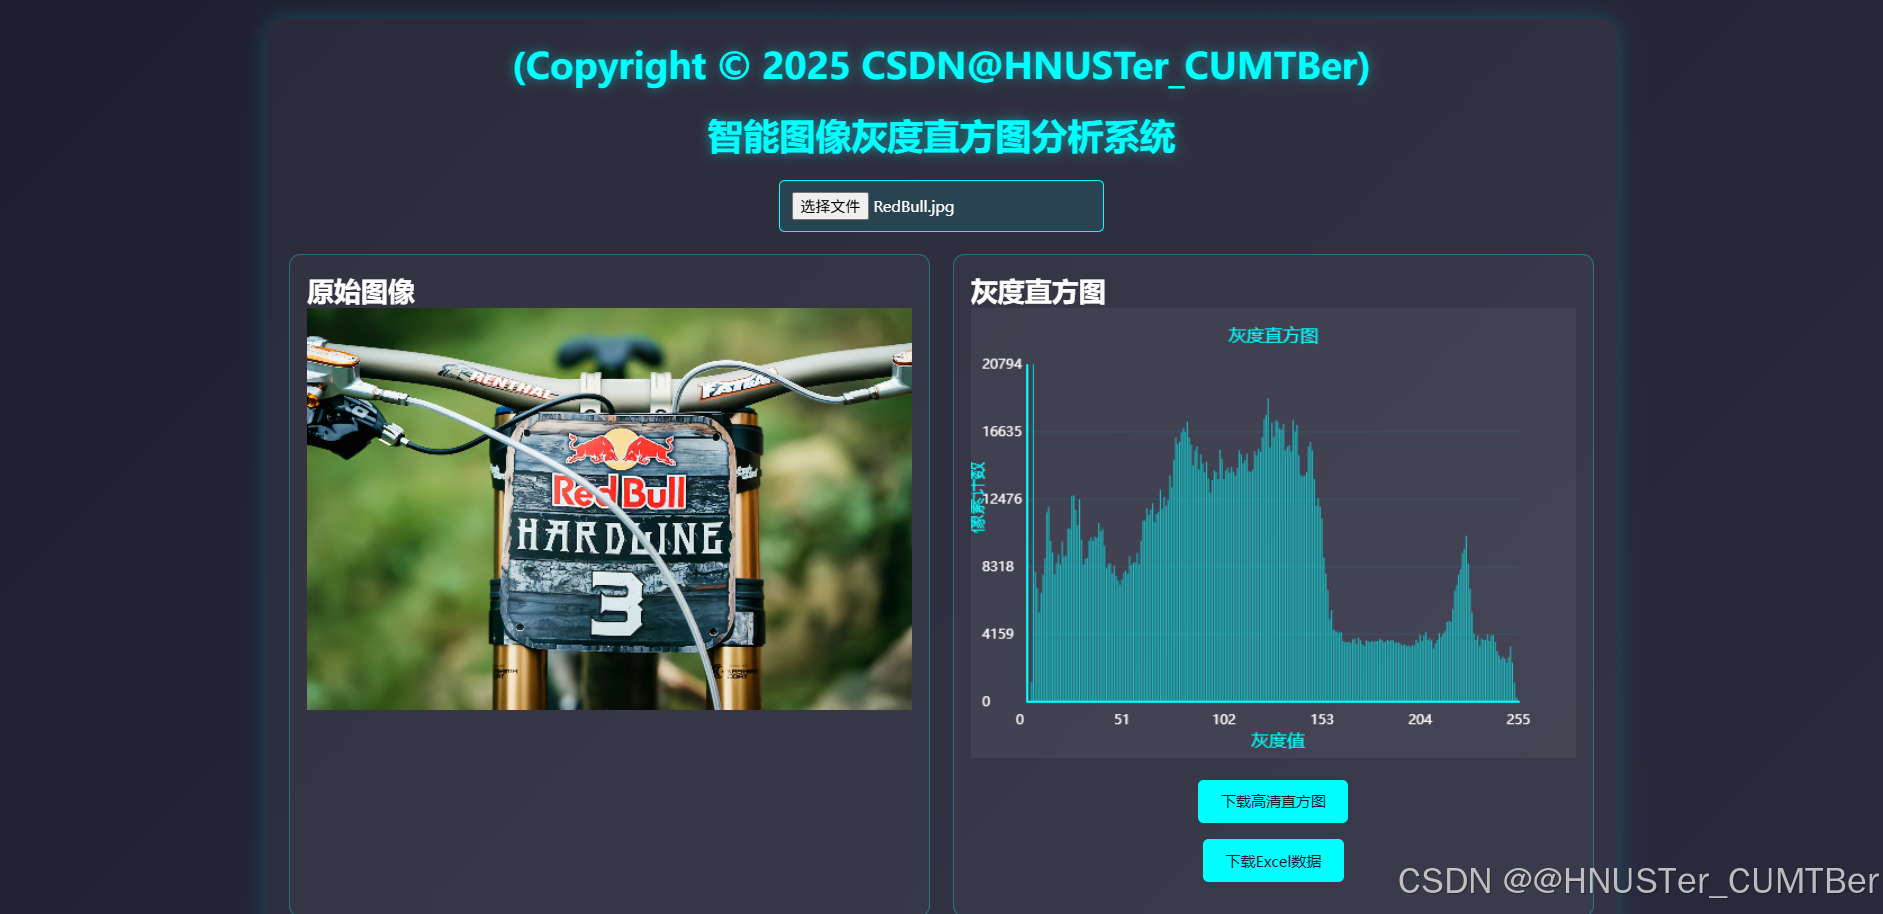
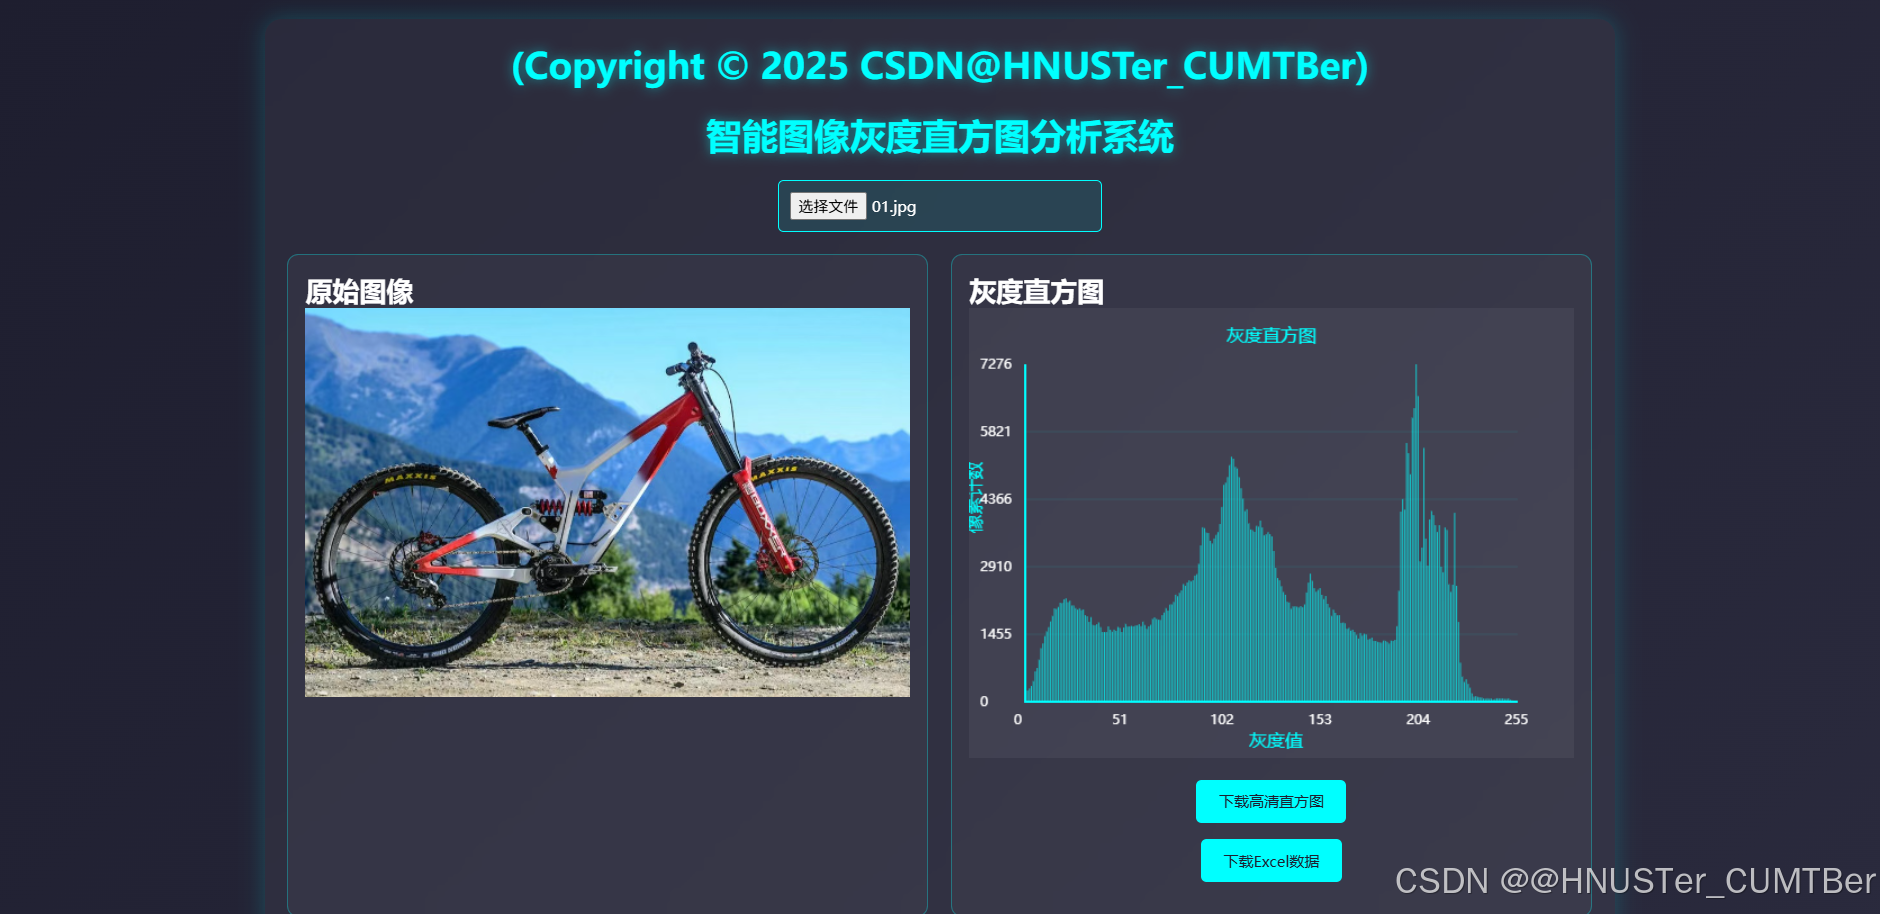
4 运行结果
5 总结

1 前言
在图像处理领域,灰度直方图是分析图像亮度分布、优化图像质量的核心工具 —— 它能直观呈现图像中不同灰度级(0-255)的像素数量占比,是图像增强、瑕疵检测、曝光调整的重要依据。然而,传统获取灰度直方图的方式存在明显痛点:专业软件(如 Photoshop、OpenCV)操作复杂,需掌握特定工具链;在线工具多存在功能局限(如无法下载原始数据、直方图分辨率低);本地代码实现则需手动处理图像解析、像素计算等繁琐步骤。
为解决这些问题,本文实现了一款轻量级智能图像灰度直方图分析系统,基于纯前端技术栈(HTML+CSS+JavaScript),无需后端依赖,可直接在浏览器中运行。系统核心优势如下:
- 零门槛操作:仅需 “上传图像” 即可自动生成灰度直方图,无需专业知识;
- 双维度输出:支持下载高清直方图图像(PNG 格式,1920×1080 分辨率)与原始数据(CSV 格式,可直接用 Excel 打开);
- 自适应体验:页面布局随设备尺寸动态调整,兼容电脑、平板等不同终端;
- 实时高效计算:基于 Canvas API 解析图像像素,毫秒级完成灰度转换与直方图绘制,无延迟感。
2 技术实现
系统遵循前端 “结构 - 样式 - 交互” 三层分离原则,各层职责明确且协同配合,确保功能完整性与代码可维护性。
2.1 HTML 结构:搭建模块化页面骨架
HTML 的核心作用是定义页面 “组件构成” 与 “DOM 元素关系”,为后续样式渲染和交互逻辑提供基础。本系统的 HTML 结构围绕 “图像上传 - 结果展示 - 功能下载” 的用户流程设计,关键组件模块化拆分,便于后续操作 DOM 元素。
2.1.1 核心组件设计
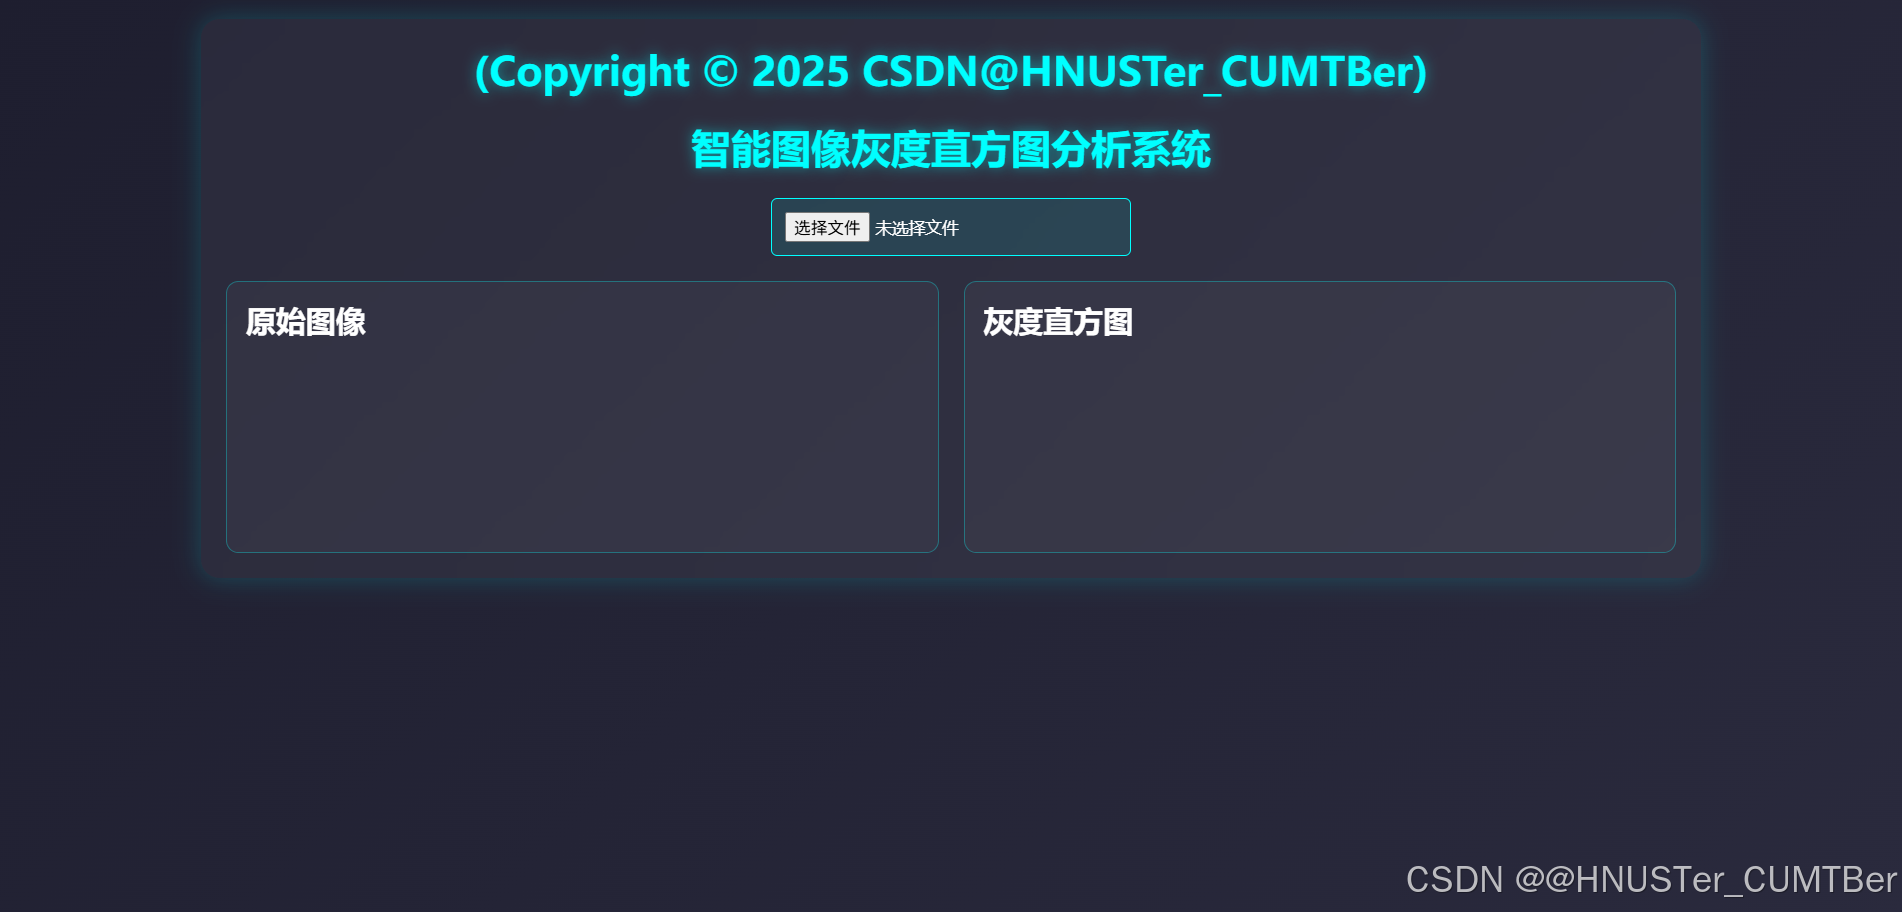
页面共包含 5 个核心模块,各模块功能与 DOM 结构对应关系如下:
- 容器模块(.container):包裹所有子组件,统一控制页面整体样式与布局;
- 标题模块(h1):明确系统名称与版权信息,强化品牌识别;
- 上传模块(.upload-area + input [type="file"]):提供图像文件选择入口,限制仅接收图像格式(accept="image/*");
- 内容展示模块(.content):分为 “原始图像区(.image-box)” 和 “直方图区(.histogram-box)”,左右布局便于对比;
- 下载模块(.download-btn + .download-data-btn):默认隐藏,仅在直方图生成后显示,提供两种下载功能。
2.1.2 完整 HTML 代码
<!DOCTYPE html>
<html lang="zh-CN">
<head><meta charset="UTF-8"><meta name="viewport" content="width=device-width, initial-scale=1.0"><title>智能图像灰度直方图分析系统</title><style>/* 后续CSS代码 */</style>
</head>
<body><div class="container"><!-- 版权与标题 --><h1>(Copyright © 2025 CSDN@HNUSTer_CUMTBer)</h1><h1>智能图像灰度直方图分析系统</h1><!-- 图像上传区 --><div class="upload-area"><input type="file" id="imageInput" accept="image/*"></div><!-- 内容展示区(原始图像 + 直方图) --><div class="content"><div class="image-box"><h2>原始图像</h2><canvas id="originalCanvas"></canvas></div><div class="histogram-box"><h2>灰度直方图</h2><canvas id="histogramCanvas"></canvas><!-- 下载按钮(默认隐藏) --><button class="download-btn" id="downloadBtn" style="display: none;">下载高清直方图</button><button class="download-data-btn" id="downloadDataBtn" style="display: none;">下载Excel数据</button></div></div></div><script>/* 后续JS代码 */</script>
</body>
</html>
2.1.3 结构设计思路
- 语义化标签:使用
<h1>、<h2>明确标题层级,<canvas>专门用于图像绘制,提升代码可读性与 SEO 友好性; - ID 命名规范:所有需通过 JS 操作的元素(如
imageInput、originalCanvas)均设置唯一 ID,便于精准获取 DOM 节点; - 初始状态控制:下载按钮默认隐藏(
style="display: none;"),避免用户未上传图像时误操作,提升交互合理性。
2.2 CSS 样式:打造科技感与易用性兼顾的视觉体验
CSS 的核心目标是 “优化视觉呈现” 与 “强化交互反馈”,本系统采用 “深色科技风” 设计,既符合图像处理工具的专业定位,又能突出直方图的青色核心元素,同时通过响应式布局适配不同设备。
2.2.1 核心样式逻辑
样式设计围绕 “全局统一风格 + 模块差异化” 展开,关键设计点包括:
- 全局样式重置:清除默认 margin/padding,使用
box-sizing: border-box确保布局计算准确; - 背景与容器:采用渐变背景(
linear-gradient(135deg, #1e1e2f, #2a2a3d))营造科技感,容器添加半透明模糊效果(backdrop-filter: blur(10px))提升层次感; - 交互反馈:按钮 hover 时添加颜色变化与发光效果(
box-shadow: 0 0 15px rgba(0, 255, 255, 0.5)),明确操作状态; - 响应式布局:通过
flex-wrap: wrap和min-width确保小屏幕设备下 “原始图像区” 与 “直方图区” 自动垂直排列,避免内容溢出。
2.2.2 完整 CSS 代码
* {margin: 0;padding: 0;box-sizing: border-box;font-family: "Microsoft YaHei", sans-serif;
}
body {background: linear-gradient(135deg, #1e1e2f, #2a2a3d);color: #ffffff;min-height: 100vh;display: flex;flex-direction: column;align-items: center;padding: 20px;
}
.container {width: 100%;max-width: 1200px;background: rgba(255, 255, 255, 0.05);border-radius: 15px;padding: 20px;box-shadow: 0 0 20px rgba(0, 255, 255, 0.2);backdrop-filter: blur(10px);
}
h1 {text-align: center;margin-bottom: 20px;color: #00ffff;text-shadow: 0 0 10px rgba(0, 255, 255, 0.5);
}
.upload-area {display: flex;justify-content: center;margin-bottom: 20px;
}
input[type="file"] {padding: 10px;background: rgba(0, 255, 255, 0.1);border: 1px solid #00ffff;border-radius: 5px;color: #ffffff;cursor: pointer;
}
.content {display: flex;flex-wrap: wrap;gap: 20px;justify-content: center;
}
.image-box, .histogram-box {flex: 1;min-width: 300px;background: rgba(255, 255, 255, 0.03);padding: 15px;border-radius: 10px;border: 1px solid rgba(0, 255, 255, 0.3);
}
canvas {max-width: 100%;height: auto;
}
.download-btn, .download-data-btn {display: block;margin: 15px auto;padding: 10px 20px;background: #00ffff;color: #1e1e2f;border: none;border-radius: 5px;cursor: pointer;transition: all 0.3s;
}
.download-btn:hover, .download-data-btn:hover {background: #00cccc;box-shadow: 0 0 15px rgba(0, 255, 255, 0.5);
}
2.2.3 样式设计亮点
- 色彩体系统一:核心色采用 “青色(#00ffff)”,与深色背景形成强烈对比,既突出关键元素(标题、按钮、直方图),又避免视觉杂乱;
- 细节优化:容器添加轻微发光阴影(
box-shadow: 0 0 20px rgba(0, 255, 255, 0.2)),增强页面立体感;按钮文字颜色与背景色反色,确保可读性; - 自适应优先级:
content容器的flex-wrap: wrap确保小屏幕下内容不溢出,min-width: 300px保证模块在手机端仍有足够操作空间。
2.3 JavaScript 交互:实现核心功能逻辑
JavaScript 是系统的 “大脑”,负责串联 “图像上传 - 灰度计算 - 直方图绘制 - 下载输出” 全流程,核心依赖 Canvas API 实现图像像素级操作,关键逻辑拆分为 5 个核心函数,确保代码可复用与可维护。
2.3.1 初始化与事件绑定
首先获取所有需操作的 DOM 元素,并为 “图像上传” 按钮绑定change事件,触发后续流程:
// 获取DOM元素
const imageInput = document.getElementById('imageInput');
const originalCanvas = document.getElementById('originalCanvas');
const histogramCanvas = document.getElementById('histogramCanvas');
const downloadBtn = document.getElementById('downloadBtn');
const downloadDataBtn = document.getElementById('downloadDataBtn');
// 获取Canvas 2D上下文(用于绘制)
const ctxOriginal = originalCanvas.getContext('2d');
const ctxHistogram = histogramCanvas.getContext('2d');// 绑定图像上传事件
imageInput.addEventListener('change', handleImageUpload);
2.3.2 核心函数解析
系统的核心逻辑通过 5 个函数实现,各函数职责与调用关系如下:handleImageUpload(入口)→ computeHistogram(计算灰度分布)→ drawHistogram(绘制直方图)→ downloadHistogram/downloadExcelData(下载功能)。
-
函数 1:handleImageUpload(图像上传与初始化)
负责读取用户上传的图像文件,将其渲染到 “原始图像” Canvas,并调用computeHistogram计算灰度分布:
function handleImageUpload(e) {const file = e.target.files[0]; // 获取上传的文件if (!file) return; // 若未选择文件,直接返回const img = new Image(); // 创建Image对象(用于加载图像)const reader = new FileReader(); // 创建FileReader(用于读取文件内容)// 读取文件完成后,将内容设置为Image的srcreader.onload = function(event) {img.src = event.target.result; // 结果为DataURL(base64格式)};// 图像加载完成后,渲染到原始图像Canvasimg.onload = function() {// 计算缩放比例:确保图像不超过容器宽度,同时保持比例const maxWidth = originalCanvas.parentElement.clientWidth - 30;const scale = Math.min(maxWidth / img.width, 1); // 缩放比例不超过1(避免放大失真)// 设置Canvas尺寸originalCanvas.width = img.width * scale;originalCanvas.height = img.height * scale;// 绘制原始图像到CanvasctxOriginal.drawImage(img, 0, 0, originalCanvas.width, originalCanvas.height);// 调用灰度直方图计算函数computeHistogram(img);};// 以DataURL格式读取图像文件reader.readAsDataURL(file);
}-
函数 2:computeHistogram(计算灰度分布)
将彩色图像转换为灰度图像,并统计每个灰度级(0-255)的像素数量,核心是 “灰度计算公式” 与 “像素遍历”:
function computeHistogram(img) {// 创建临时Canvas(用于获取原始图像像素,不影响页面显示)const tempCanvas = document.createElement('canvas');tempCanvas.width = img.width;tempCanvas.height = img.height;const tempCtx = tempCanvas.getContext('2d');// 填充白色背景(避免透明像素影响计算)tempCtx.fillStyle = '#ffffff';tempCtx.fillRect(0, 0, img.width, img.height);// 绘制原始图像到临时CanvastempCtx.drawImage(img, 0, 0);// 获取图像像素数据:Uint8ClampedArray,每个像素占4个元素(R、G、B、A)const imageData = tempCtx.getImageData(0, 0, img.width, img.height);const data = imageData.data;// 初始化直方图数组:256个元素(对应灰度0-255),初始值为0const histogram = new Array(256).fill(0);// 遍历所有像素(步长为4,每次处理一个像素的R、G、B、A)for (let i = 0; i < data.length; i += 4) {const r = data[i];     // 红色通道const g = data[i + 1]; // 绿色通道const b = data[i + 2]; // 蓝色通道const a = data[i + 3]; // 透明通道(0=完全透明,255=完全不透明)// 灰度计算公式(国际标准:Y = 0.299R + 0.587G + 0.114B)const gray = Math.round(0.299 * r + 0.587 * g + 0.114 * b);// 累加对应灰度级的像素数量(透明像素按透明度比例计算,避免影响结果)histogram[gray] += a / 255;}// 调用直方图绘制函数drawHistogram(histogram);
}-
函数 3:drawHistogram(绘制灰度直方图)
基于计算出的灰度分布数据,在 “直方图” Canvas 上绘制包含 “背景网格、坐标系、刻度、直方图柱形” 的完整图表,并显示下载按钮:
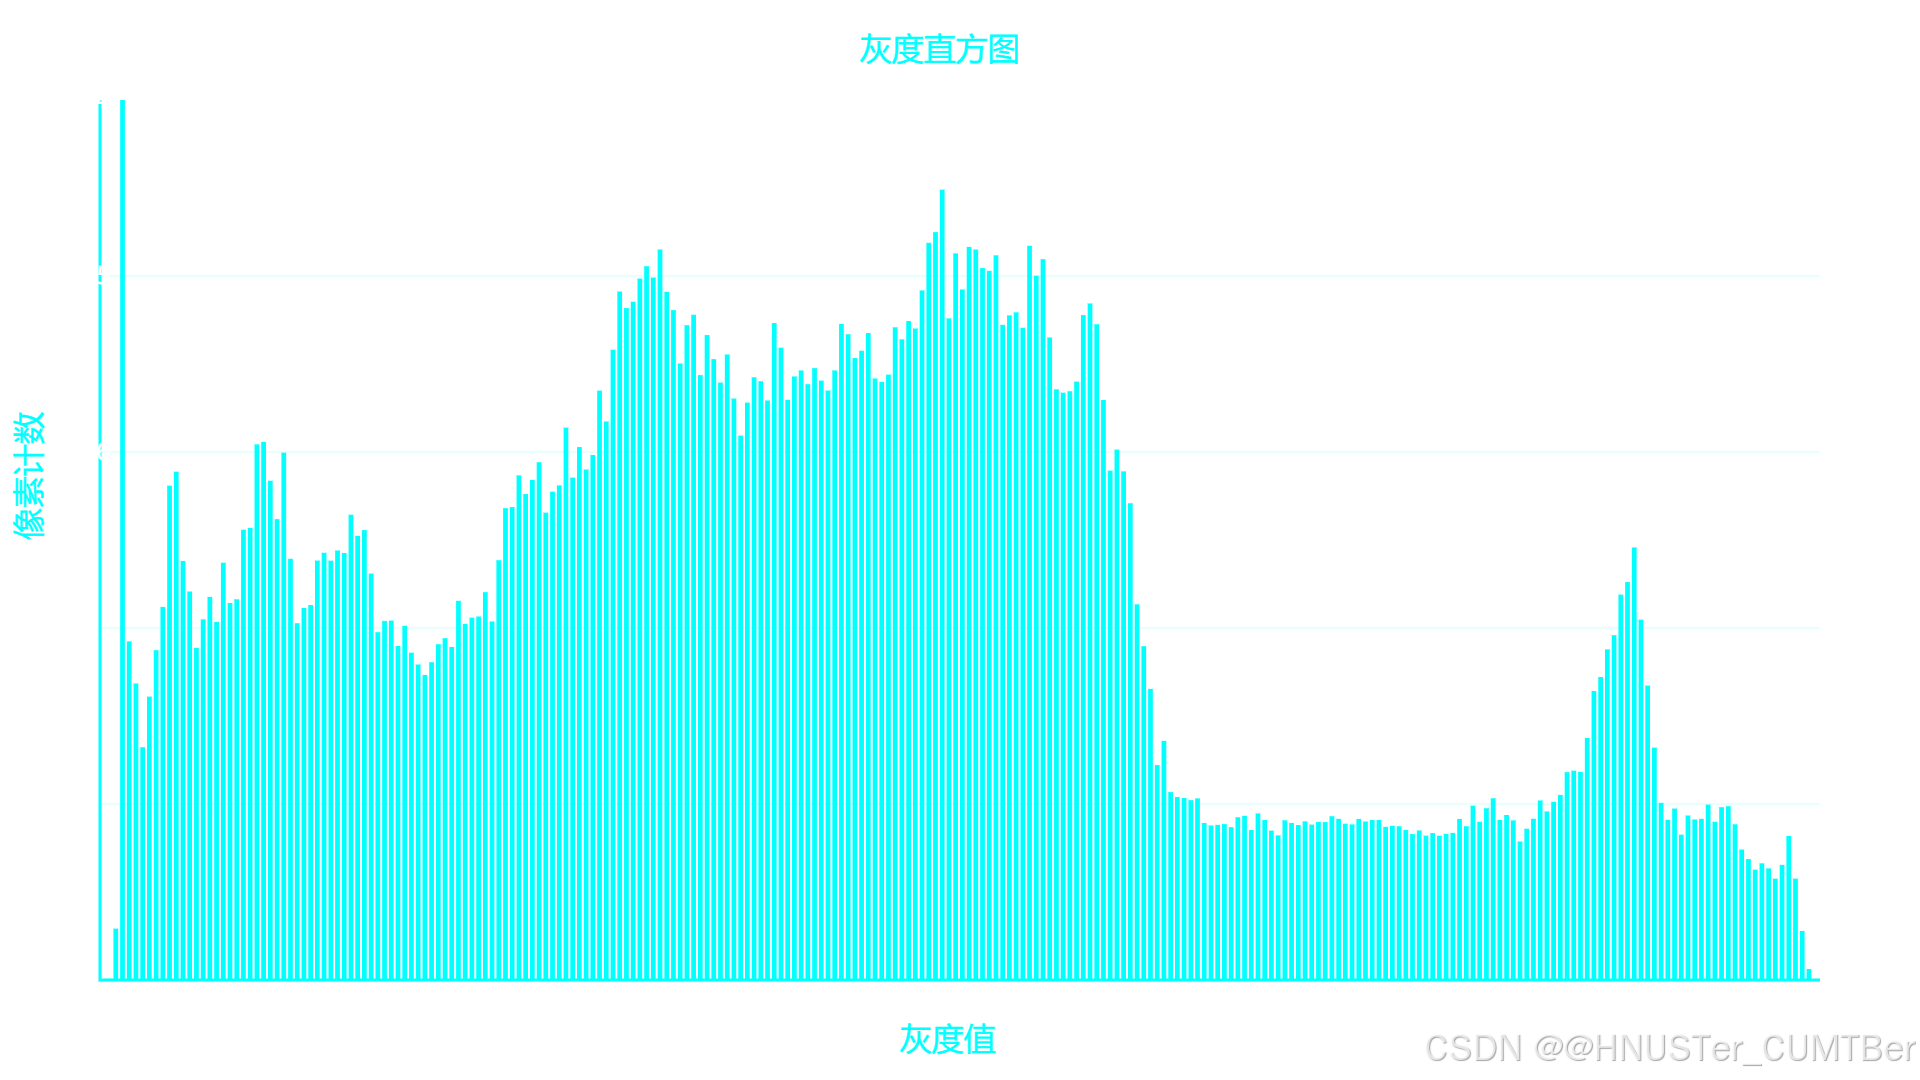
function drawHistogram(histogram) {// 设置直方图Canvas尺寸(基于父容器宽度,固定高度400px)const width = histogramCanvas.parentElement.clientWidth - 30;const height = 400;histogramCanvas.width = width;histogramCanvas.height = height;// 计算最大像素数量(用于归一化柱形高度,确保所有柱形都能显示)const maxValue = Math.max(...histogram);// 计算每个柱形的宽度(预留左右边距50px,256个柱形)const barWidth = (width - 100) / 256;// 1. 绘制背景与网格ctxHistogram.fillStyle = 'rgba(255, 255, 255, 0.05)';ctxHistogram.fillRect(0, 0, width, height); // 填充背景ctxHistogram.strokeStyle = 'rgba(0, 255, 255, 0.2)';ctxHistogram.lineWidth = 0.5;// 绘制水平网格线(5条,均分高度)for (let i = 1; i < 5; i++) {const y = 50 + (height - 100) * (i / 5);ctxHistogram.beginPath();ctxHistogram.moveTo(50, y); // 左起点(x=50,预留边距)ctxHistogram.lineTo(width - 50, y); // 右终点ctxHistogram.stroke();}// 2. 绘制坐标系(x轴:灰度值,y轴:像素计数)ctxHistogram.strokeStyle = '#00ffff';ctxHistogram.lineWidth = 2;ctxHistogram.beginPath();ctxHistogram.moveTo(50, 50); // 左上角起点ctxHistogram.lineTo(50, height - 50); // 左侧y轴ctxHistogram.lineTo(width - 50, height - 50); // 底部x轴ctxHistogram.stroke();// 3. 绘制标题与轴标签ctxHistogram.fillStyle = '#00ffff';ctxHistogram.font = '16px Microsoft YaHei';ctxHistogram.fillText('灰度直方图', width /3 完整代码
<!DOCTYPE html>
<html lang="zh-CN">
<head><meta charset="UTF-8"><meta name="viewport" content="width=device-width, initial-scale=1.0"><title>智能图像灰度直方图分析系统</title><style>* {margin: 0;padding: 0;box-sizing: border-box;font-family: "Microsoft YaHei", sans-serif;}body {background: linear-gradient(135deg, #1e1e2f, #2a2a3d);color: #ffffff;min-height: 100vh;display: flex;flex-direction: column;align-items: center;padding: 20px;}.container {width: 100%;max-width: 1200px;background: rgba(255, 255, 255, 0.05);border-radius: 15px;padding: 20px;box-shadow: 0 0 20px rgba(0, 255, 255, 0.2);backdrop-filter: blur(10px);}h1 {text-align: center;margin-bottom: 20px;color: #00ffff;text-shadow: 0 0 10px rgba(0, 255, 255, 0.5);}.upload-area {display: flex;justify-content: center;margin-bottom: 20px;}input[type="file"] {padding: 10px;background: rgba(0, 255, 255, 0.1);border: 1px solid #00ffff;border-radius: 5px;color: #ffffff;cursor: pointer;}.content {display: flex;flex-wrap: wrap;gap: 20px;justify-content: center;}.image-box, .histogram-box {flex: 1;min-width: 300px;background: rgba(255, 255, 255, 0.03);padding: 15px;border-radius: 10px;border: 1px solid rgba(0, 255, 255, 0.3);}canvas {max-width: 100%;height: auto;}.download-btn, .download-data-btn {display: block;margin: 15px auto;padding: 10px 20px;background: #00ffff;color: #1e1e2f;border: none;border-radius: 5px;cursor: pointer;transition: all 0.3s;}.download-btn:hover, .download-data-btn:hover {background: #00cccc;box-shadow: 0 0 15px rgba(0, 255, 255, 0.5);}</style>
</head>
<body><div class="container"><h1>(Copyright © 2025 CSDN@HNUSTer_CUMTBer)</h1><h1>智能图像灰度直方图分析系统</h1><div class="upload-area"><input type="file" id="imageInput" accept="image/*"></div><div class="content"><div class="image-box"><h2>原始图像</h2><canvas id="originalCanvas"></canvas></div><div class="histogram-box"><h2>灰度直方图</h2><canvas id="histogramCanvas"></canvas><button class="download-btn" id="downloadBtn" style="display: none;">下载高清直方图</button><button class="download-data-btn" id="downloadDataBtn" style="display: none;">下载Excel数据</button></div></div></div><script>const imageInput = document.getElementById('imageInput');const originalCanvas = document.getElementById('originalCanvas');const histogramCanvas = document.getElementById('histogramCanvas');const downloadBtn = document.getElementById('downloadBtn');const downloadDataBtn = document.getElementById('downloadDataBtn');const ctxOriginal = originalCanvas.getContext('2d');const ctxHistogram = histogramCanvas.getContext('2d');imageInput.addEventListener('change', handleImageUpload);function handleImageUpload(e) {const file = e.target.files[0];if (!file) return;const img = new Image();const reader = new FileReader();reader.onload = function(event) {img.src = event.target.result;};img.onload = function() {const maxWidth = originalCanvas.parentElement.clientWidth - 30;const scale = Math.min(maxWidth / img.width, 1);originalCanvas.width = img.width * scale;originalCanvas.height = img.height * scale;ctxOriginal.drawImage(img, 0, 0, originalCanvas.width, originalCanvas.height);computeHistogram(img);};reader.readAsDataURL(file);}function computeHistogram(img) {const tempCanvas = document.createElement('canvas');tempCanvas.width = img.width;tempCanvas.height = img.height;const tempCtx = tempCanvas.getContext('2d');tempCtx.fillStyle = '#ffffff';tempCtx.fillRect(0, 0, img.width, img.height);tempCtx.drawImage(img, 0, 0);const imageData = tempCtx.getImageData(0, 0, img.width, img.height);const data = imageData.data;const histogram = new Array(256).fill(0);for (let i = 0; i < data.length; i += 4) {const r = data[i];const g = data[i + 1];const b = data[i + 2];const a = data[i + 3];const gray = Math.round(0.299 * r + 0.587 * g + 0.114 * b);histogram[gray] += a / 255;}drawHistogram(histogram);}function drawHistogram(histogram) {const width = histogramCanvas.parentElement.clientWidth - 30;const height = 400;histogramCanvas.width = width;histogramCanvas.height = height;const maxValue = Math.max(...histogram);const barWidth = (width - 100) / 256;// 背景和网格ctxHistogram.fillStyle = 'rgba(255, 255, 255, 0.05)';ctxHistogram.fillRect(0, 0, width, height);ctxHistogram.strokeStyle = 'rgba(0, 255, 255, 0.2)';ctxHistogram.lineWidth = 0.5;for (let i = 1; i < 5; i++) {const y = 50 + (height - 100) * (i / 5);ctxHistogram.beginPath();ctxHistogram.moveTo(50, y);ctxHistogram.lineTo(width - 50, y);ctxHistogram.stroke();}// 坐标系ctxHistogram.strokeStyle = '#00ffff';ctxHistogram.lineWidth = 2;ctxHistogram.beginPath();ctxHistogram.moveTo(50, 50);ctxHistogram.lineTo(50, height - 50);ctxHistogram.lineTo(width - 50, height - 50);ctxHistogram.stroke();// 标题和标签ctxHistogram.fillStyle = '#00ffff';ctxHistogram.font = '16px Microsoft YaHei';ctxHistogram.fillText('灰度直方图', width / 2 - 40, 30);ctxHistogram.fillText('灰度值', width / 2 - 20, height - 10);ctxHistogram.save();ctxHistogram.translate(10, height / 2);ctxHistogram.rotate(-Math.PI / 2);ctxHistogram.fillText('像素计数', 0, 0);ctxHistogram.restore();// 刻度和数值ctxHistogram.fillStyle = '#ffffff';ctxHistogram.font = '12px Microsoft YaHei';for (let i = 0; i <= 5; i++) {const y = height - 50 - (height - 100) * (i / 5);const value = Math.round(maxValue * (i / 5));ctxHistogram.fillText(value, 10, y + 4);}for (let i = 0; i <= 255; i += 51) {const x = 50 + i * barWidth;ctxHistogram.fillText(i, x - 10, height - 30);}// 直方图ctxHistogram.fillStyle = '#00ffff';for (let i = 0; i < 256; i++) {const barHeight = (histogram[i] / maxValue) * (height - 100);ctxHistogram.fillRect(50 + i * barWidth, height - 50 - barHeight, barWidth - 1, barHeight);}downloadBtn.style.display = 'block';downloadBtn.onclick = () => downloadHistogram(histogram, maxValue);downloadDataBtn.style.display = 'block';downloadDataBtn.onclick = () => downloadExcelData(histogram);}function downloadHistogram(histogram, maxValue) {const downloadCanvas = document.createElement('canvas');const downloadCtx = downloadCanvas.getContext('2d');downloadCanvas.width = 1920;downloadCanvas.height = 1080;const barWidth = (1920 - 200) / 256;downloadCtx.fillStyle = 'rgba(255, 255, 255, 0.05)';downloadCtx.fillRect(0, 0, 1920, 1080);downloadCtx.strokeStyle = 'rgba(0, 255, 255, 0.2)';downloadCtx.lineWidth = 1;for (let i = 1; i < 5; i++) {const y = 100 + (880) * (i / 5);downloadCtx.beginPath();downloadCtx.moveTo(100, y);downloadCtx.lineTo(1820, y);downloadCtx.stroke();}downloadCtx.strokeStyle = '#00ffff';downloadCtx.lineWidth = 3;downloadCtx.beginPath();downloadCtx.moveTo(100, 100);downloadCtx.lineTo(100, 980);downloadCtx.lineTo(1820, 980);downloadCtx.stroke();downloadCtx.fillStyle = '#00ffff';downloadCtx.font = '32px Microsoft YaHei';downloadCtx.fillText('灰度直方图', 860, 60);downloadCtx.fillText('灰度值', 900, 1050);downloadCtx.save();downloadCtx.translate(40, 540);downloadCtx.rotate(-Math.PI / 2);downloadCtx.fillText('像素计数', 0, 0);downloadCtx.restore();downloadCtx.fillStyle = '#ffffff';downloadCtx.font = '24px Microsoft YaHei';for (let i = 0; i <= 5; i++) {const y = 980 - 880 * (i / 5);const value = Math.round(maxValue * (i / 5));downloadCtx.fillText(value, 40, y + 8);}for (let i = 0; i <= 255; i += 51) {const x = 100 + i * barWidth;downloadCtx.fillText(i, x - 20, 1010);}downloadCtx.fillStyle = '#00ffff';for (let i = 0; i < 256; i++) {const barHeight = (histogram[i] / maxValue) * 880;downloadCtx.fillRect(100 + i * barWidth, 980 - barHeight, barWidth - 2, barHeight);}const link = document.createElement('a');link.download = '图像灰度直方图.png';link.href = downloadCanvas.toDataURL('image/png', 1.0);link.click();}function downloadExcelData(histogram) {// 生成CSV内容let csvContent = "ID,Count\n";for (let i = 0; i < 256; i++) {csvContent += `${i},${histogram[i].toFixed(2)}\n`;}// 创建下载链接const blob = new Blob([csvContent], { type: 'text/csv;charset=utf-8;' });const link = document.createElement('a');link.href = URL.createObjectURL(blob);link.download = 'histogram_data.csv';link.click();}</script>
</body>
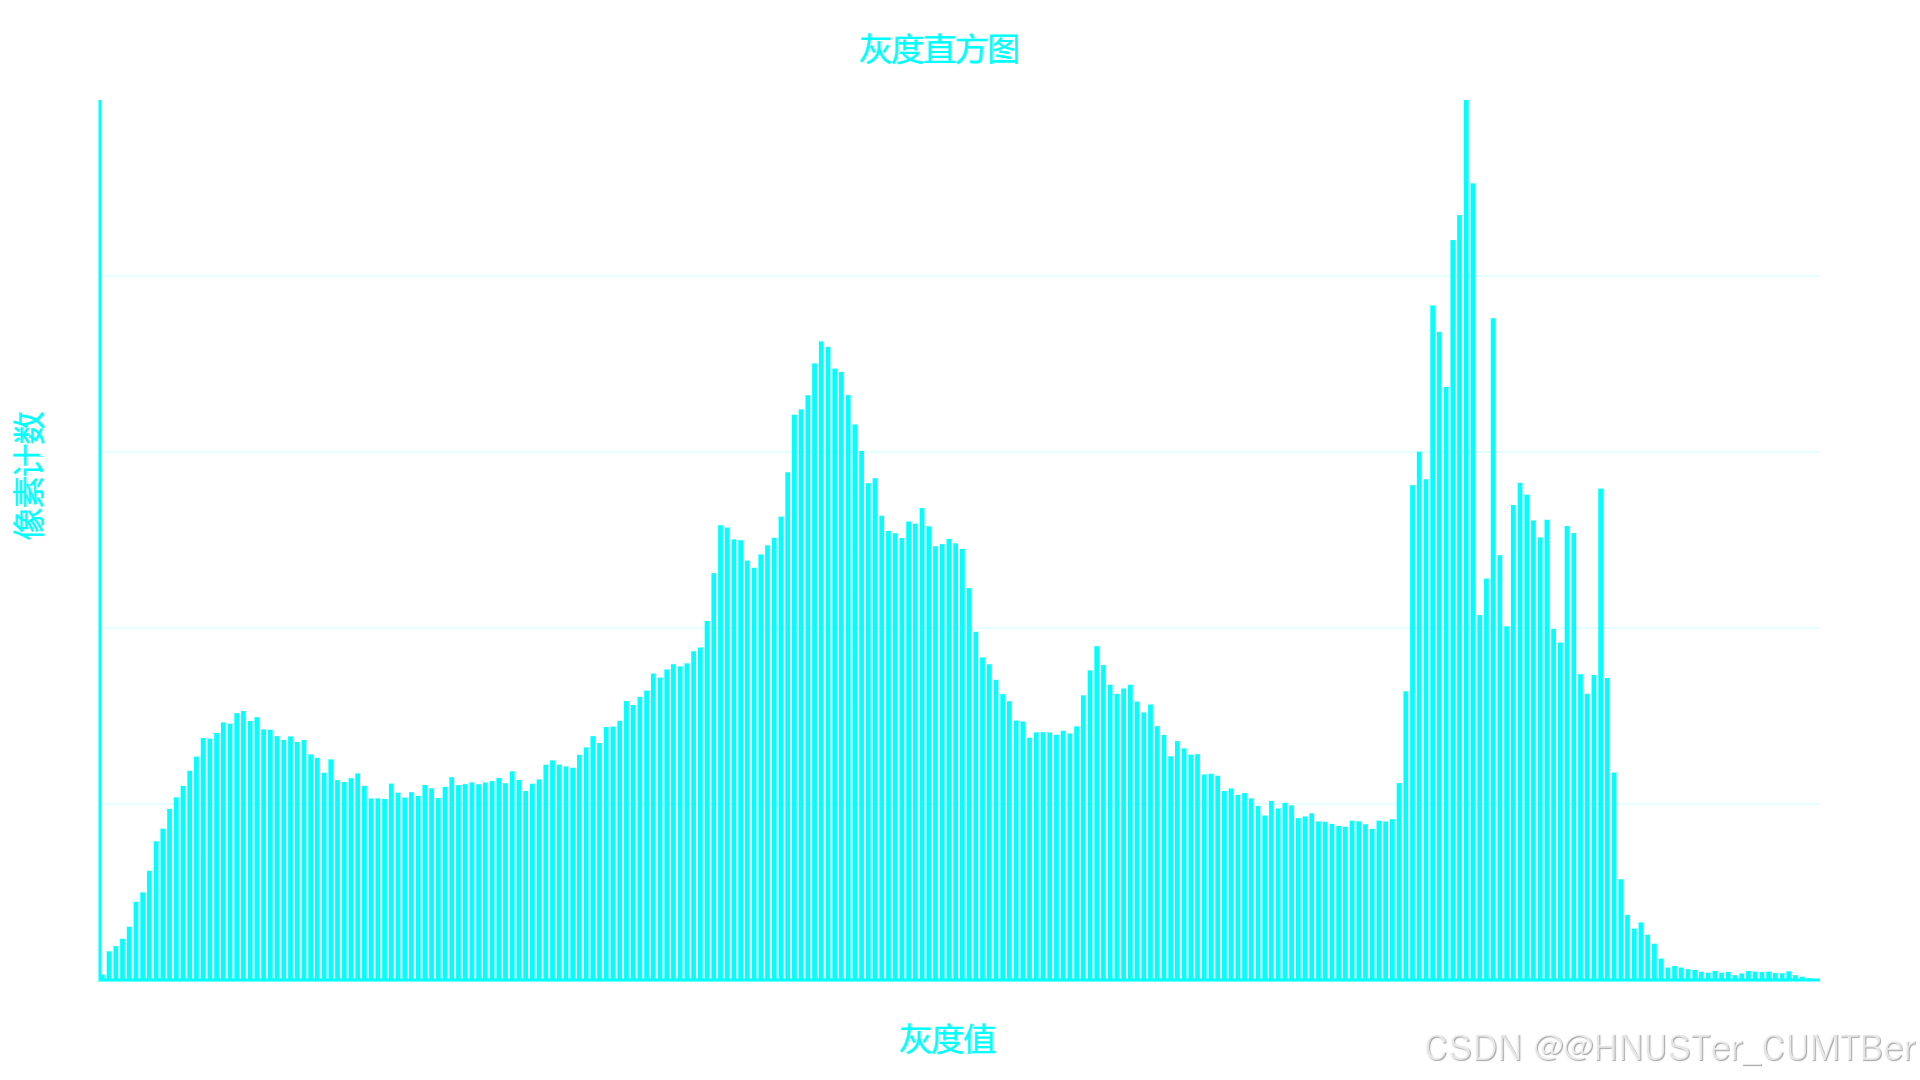
</html>4 运行结果
5 总结
本文介绍的智能图像灰度直方图分析系统,是一款基于 HTML+CSS+JavaScript 的轻量级前端工具,能解决传统获取灰度直方图方式的操作复杂、功能局限等痛点。系统采用三层架构:HTML 搭建 “上传 - 展示 - 下载” 的模块化页面骨架,确保组件清晰与交互合理;CSS 以深色科技风设计,兼顾视觉体验与响应式适配,提升界面质感;JavaScript 通过 Canvas API 实现核心功能,完成从图像上传、灰度计算、直方图绘制到数据下载的全流程,5 个核心函数保障逻辑清晰可维护。系统零门槛操作,支持高清图像和原始数据下载,适配多终端,为图像处理相关需求提供了高效便捷的解决方案,适合设计、开发等多类人群使用。