病理软件Cellprofiler使用教程
一、软件安装
下载地址:https://cellprofiler.org/releases/
直接照安装提示安装即可(我的电脑可能安装过相关环境,所以可以直接运行)
若不行可参考其他教程:https://blog.csdn.net/weixin_38594676/article/details/125034672
二、使用
2.1 了解软件大概界面
我第一次使用cellprofiler时根据下面这个视频初步了解了一下软件
https://mp.weixin.qq.com/s/gKlhPD_qBR9QImxykKcPSw
2.2 Cellprofiler pipeline示例
Cellprofiler是通过创建一系列pipeline对图像进行处理(可保存为CellProfiler Project (.cpproj)即流程文件),本次示例pipeline参考下述文献:
Machine learning-based pathomics signature of histology slides as a novel prognostic indicator in primary central nervous system lymphoma https://link.springer.com/article/10.1007/s11060-024-04665-8#MOESM4
示例流程可通过百度网盘提取:
通过网盘分享的文件:cellprofiler demo
链接: https://pan.baidu.com/s/17dhvhnh3VaanLRE2BmvbHQ?pwd=zmpj 提取码: zmpj
具体操作描述内容如下(文献):
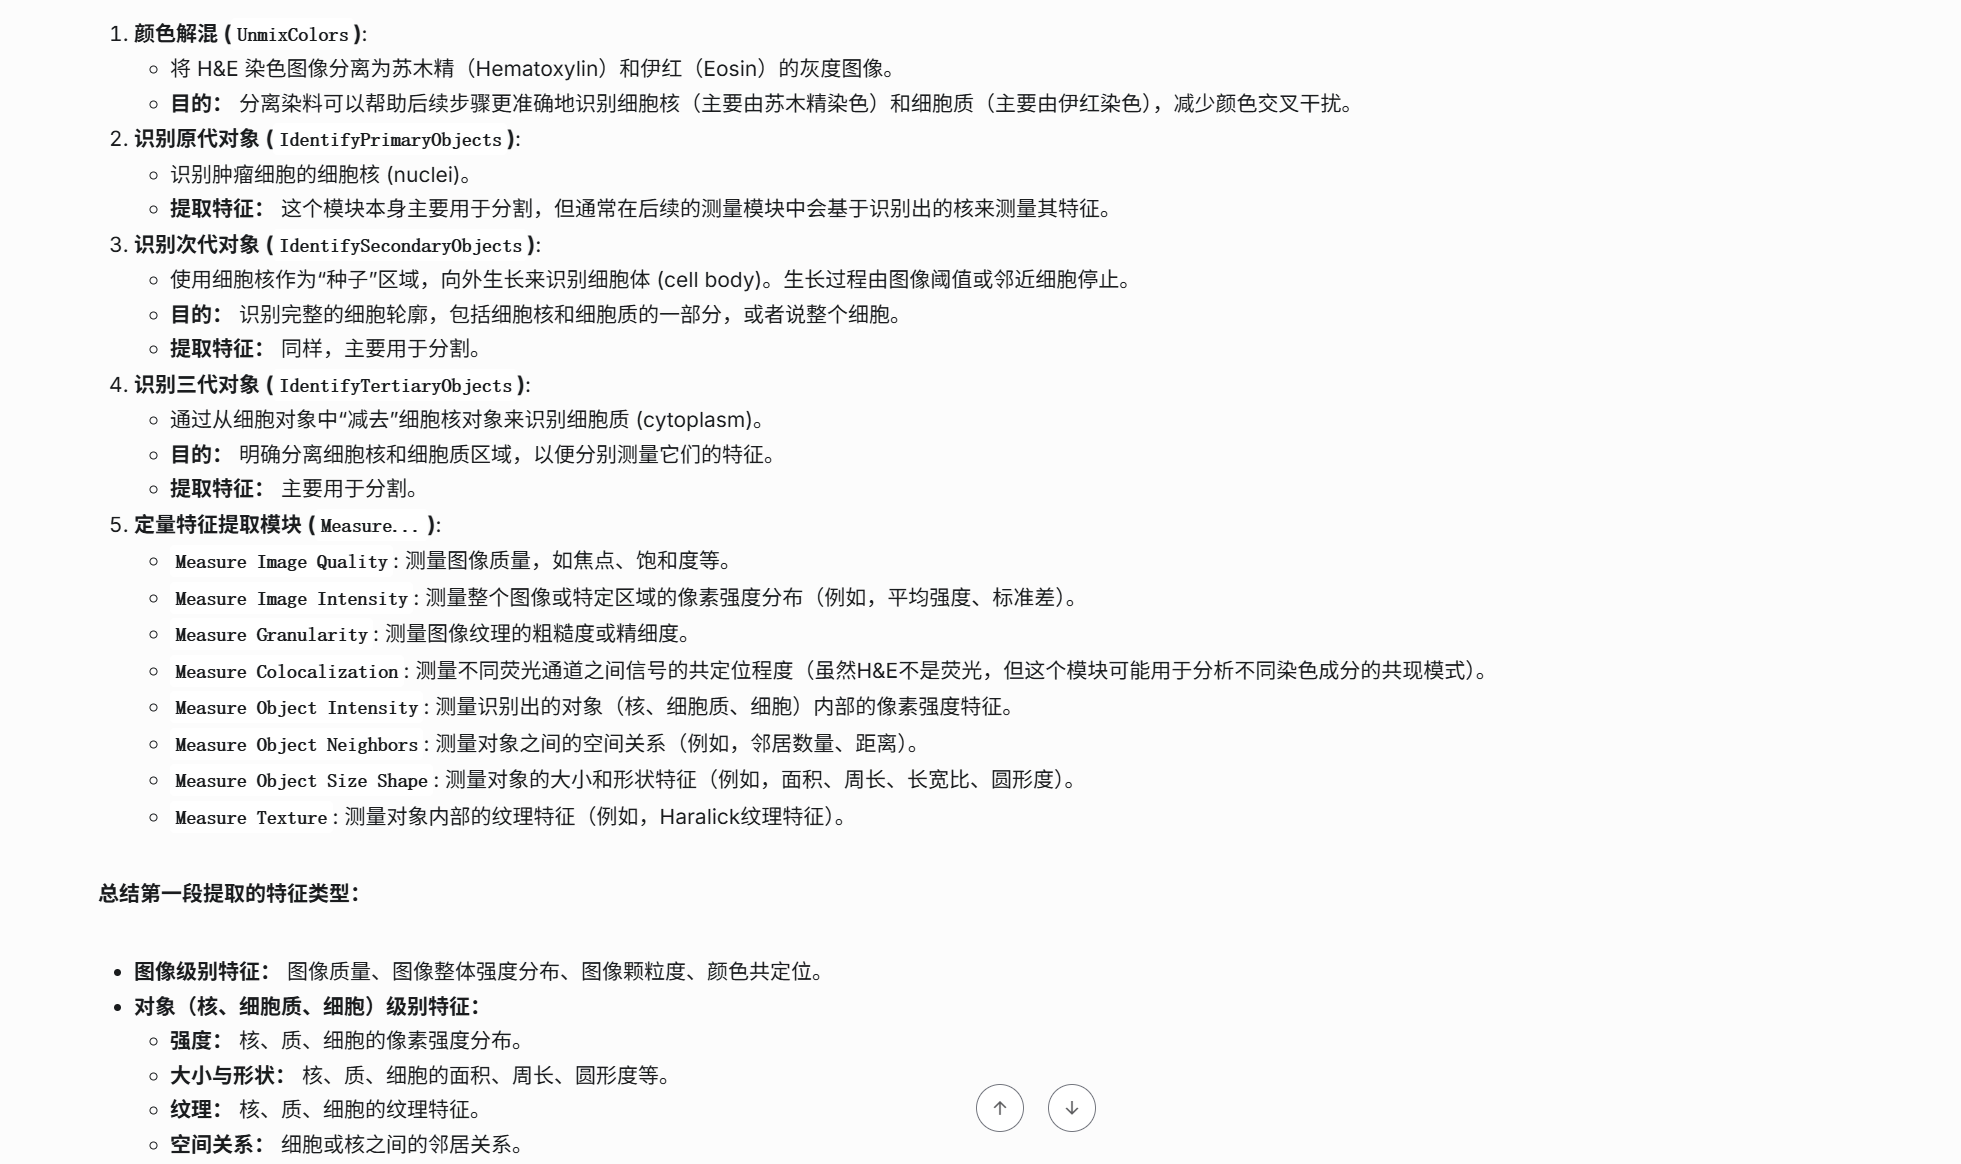
First, the images were split into hematoxylin-stained and eosin-stained greyscale images by the “UnmixColors” module. The nuclei of tumor cells were identified with the “IdentifyPrimaryObjects” module. Then the “IdentifySecondaryObjects” module identified the cell body by using the nuclei as a “seed” region, growing outwards until stopped by the image threshold or by a neighbor. Thus it identified the cytoplasm by “subtracting” the nuclei objects from the cell objects using the “IdentifyTertiaryObjects” module. The quantitative features were extracted with modules including “Measure Image Quality,” “Measure Image Intensity,” “Measure Granularity,” “Measure Colocalization,” “Measure Object Intensity,” “Measure Object Neighbors,” “Measure Object Size Shape,” and “Measure Texture” (Fig. 1b).
具体解释如下:
具体操作实操:
Step1:双击流程文件页面如下,根据Step逐步进行操作(每一步的具体参数调整本篇不做介绍):
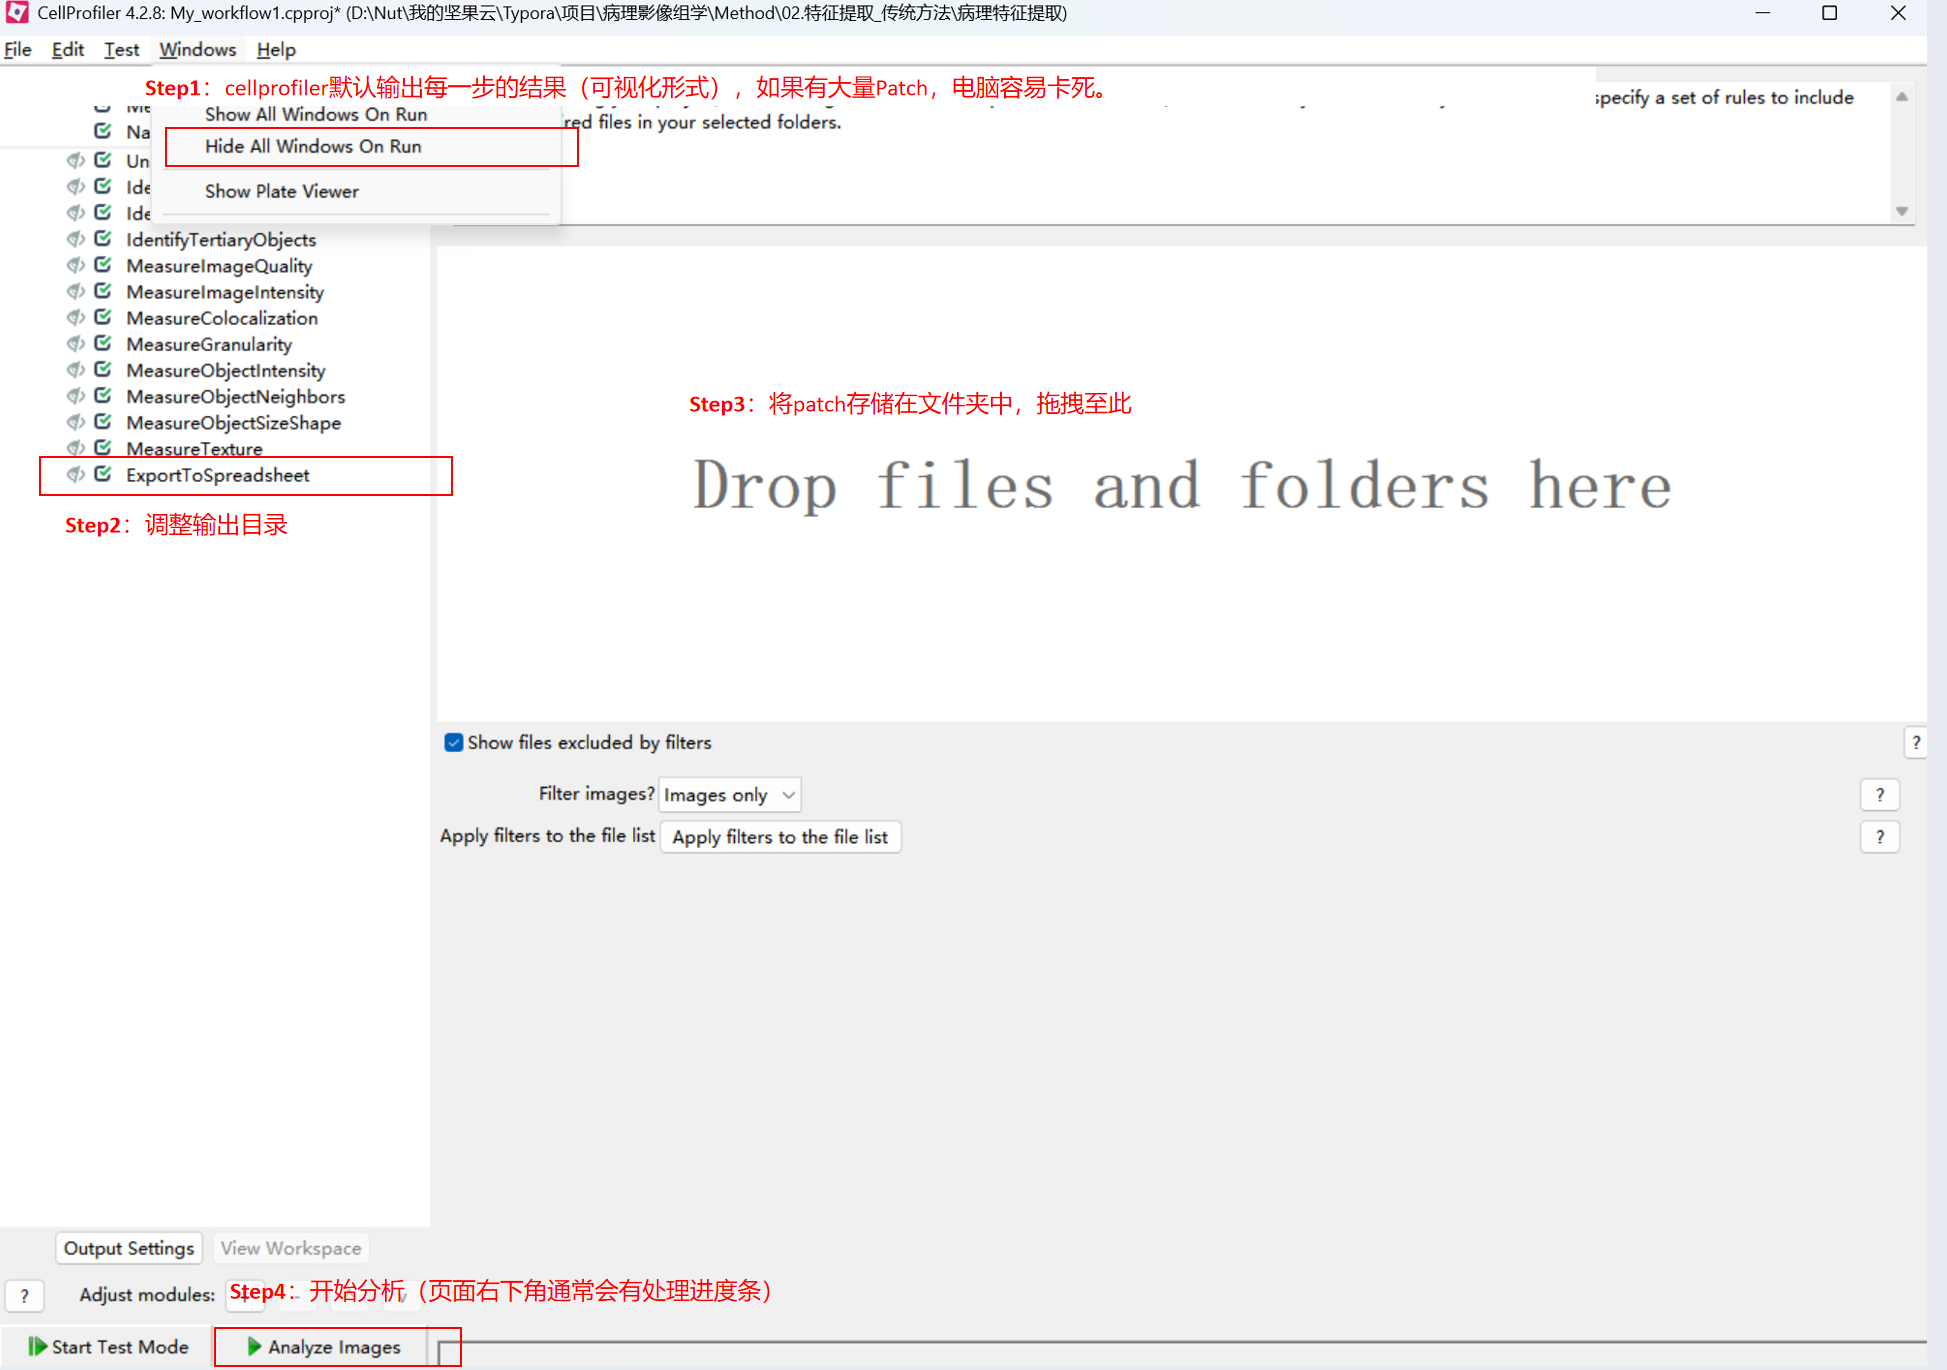
(1)输入:准备一个包含病理patch图片(png/jpg)的文件夹
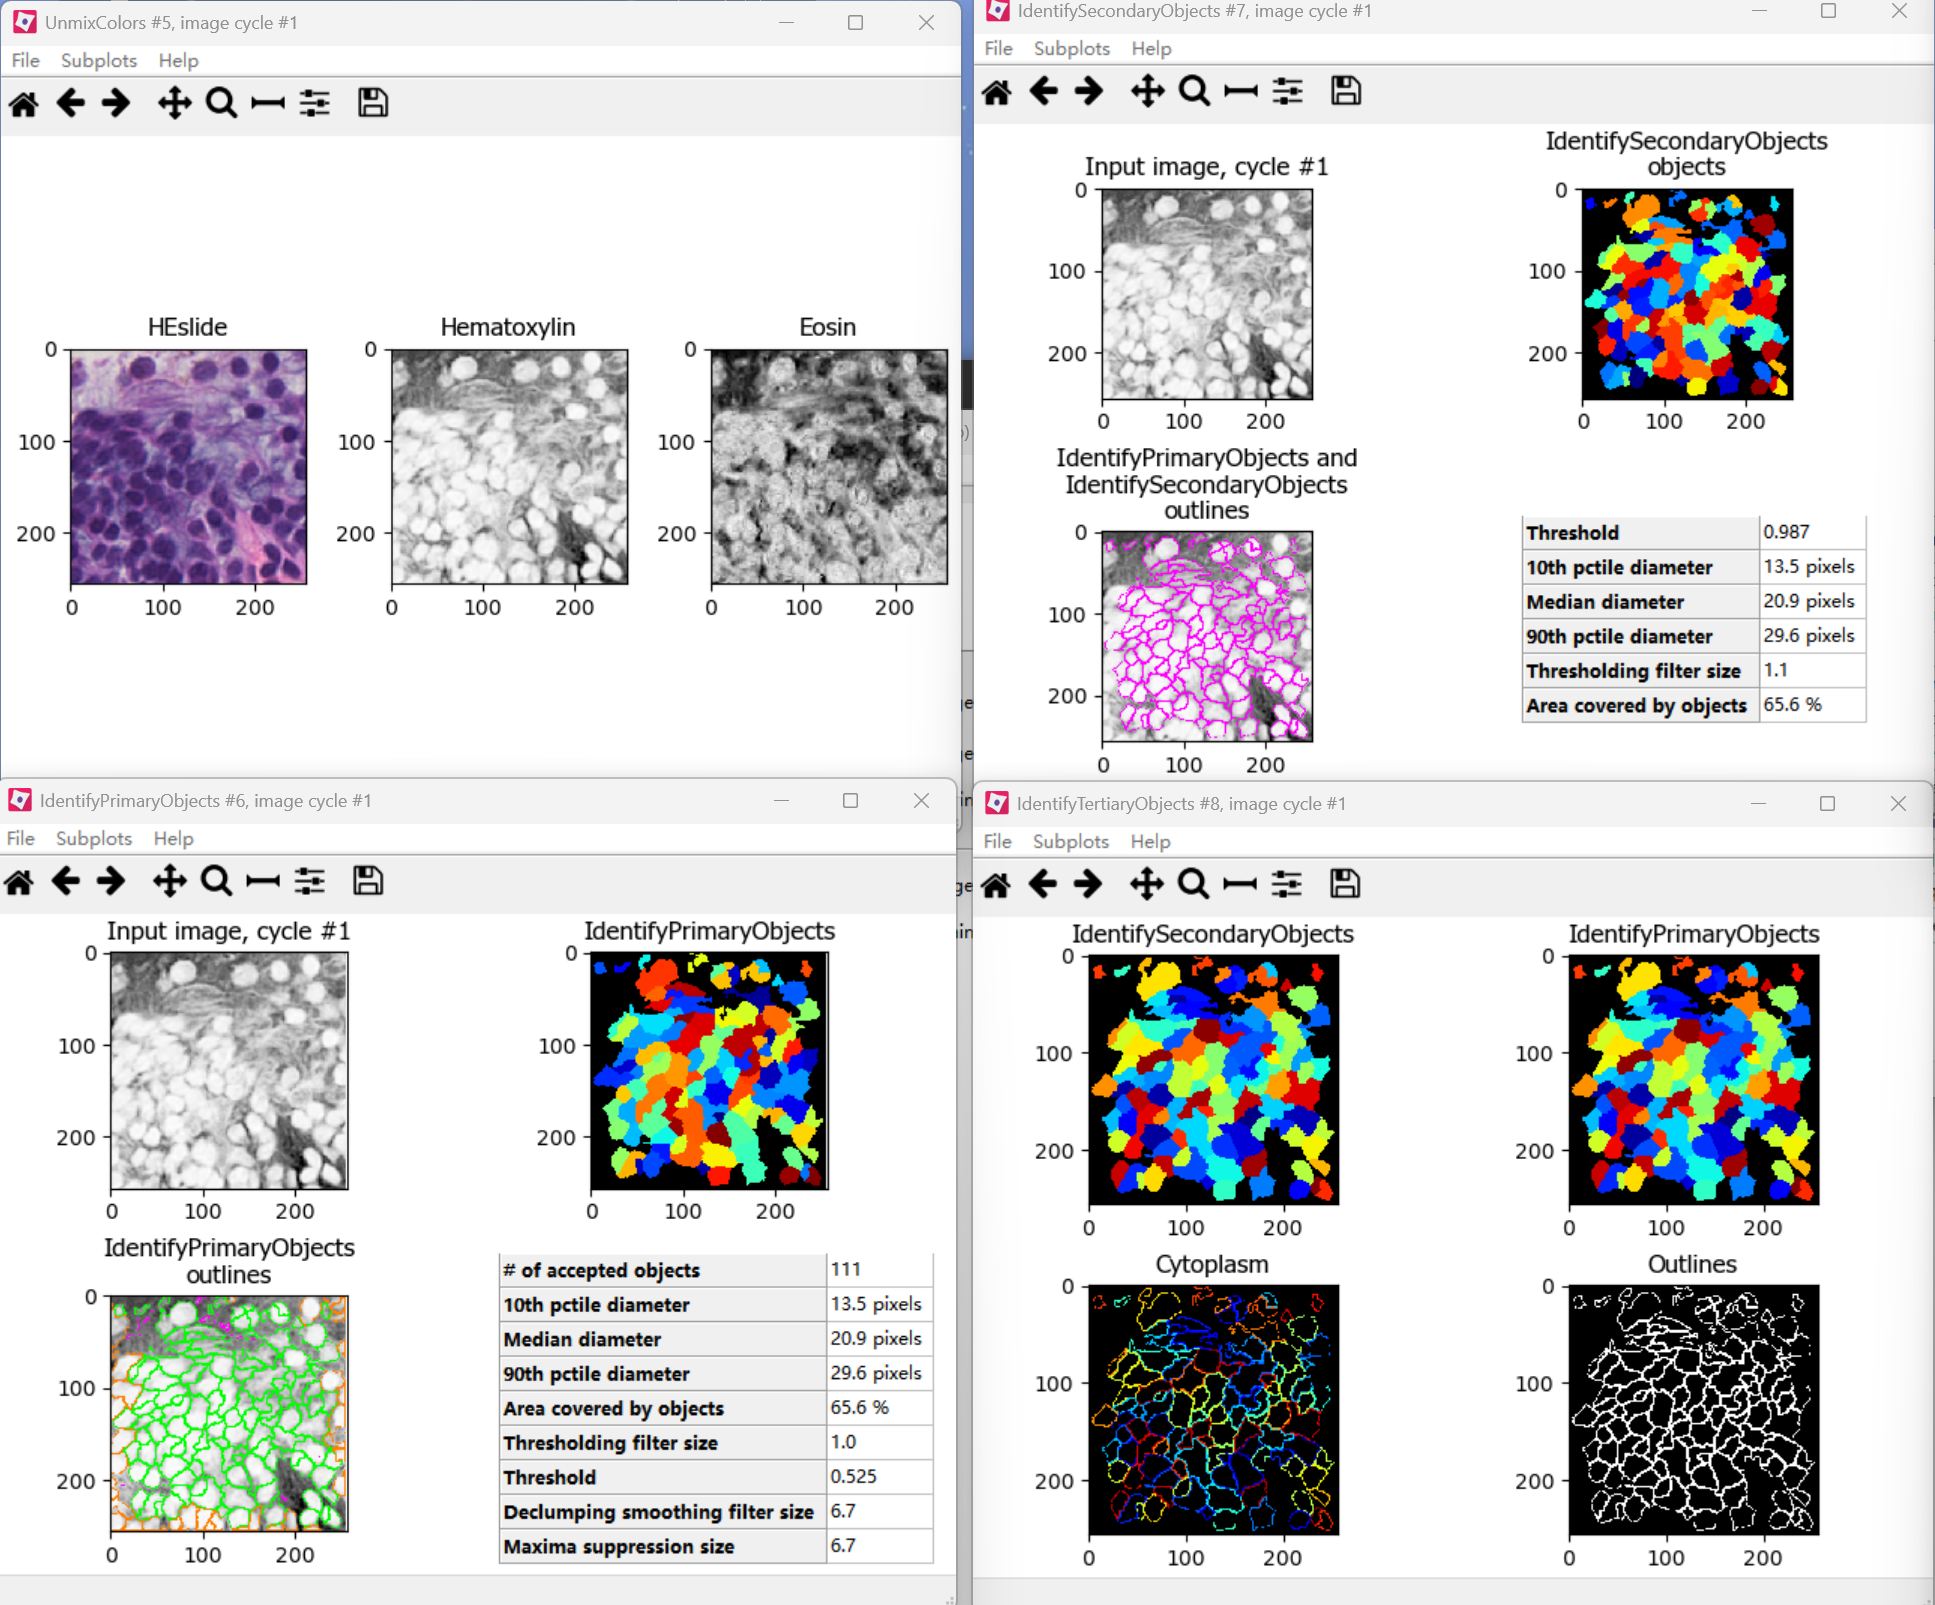
(2)过程展示:
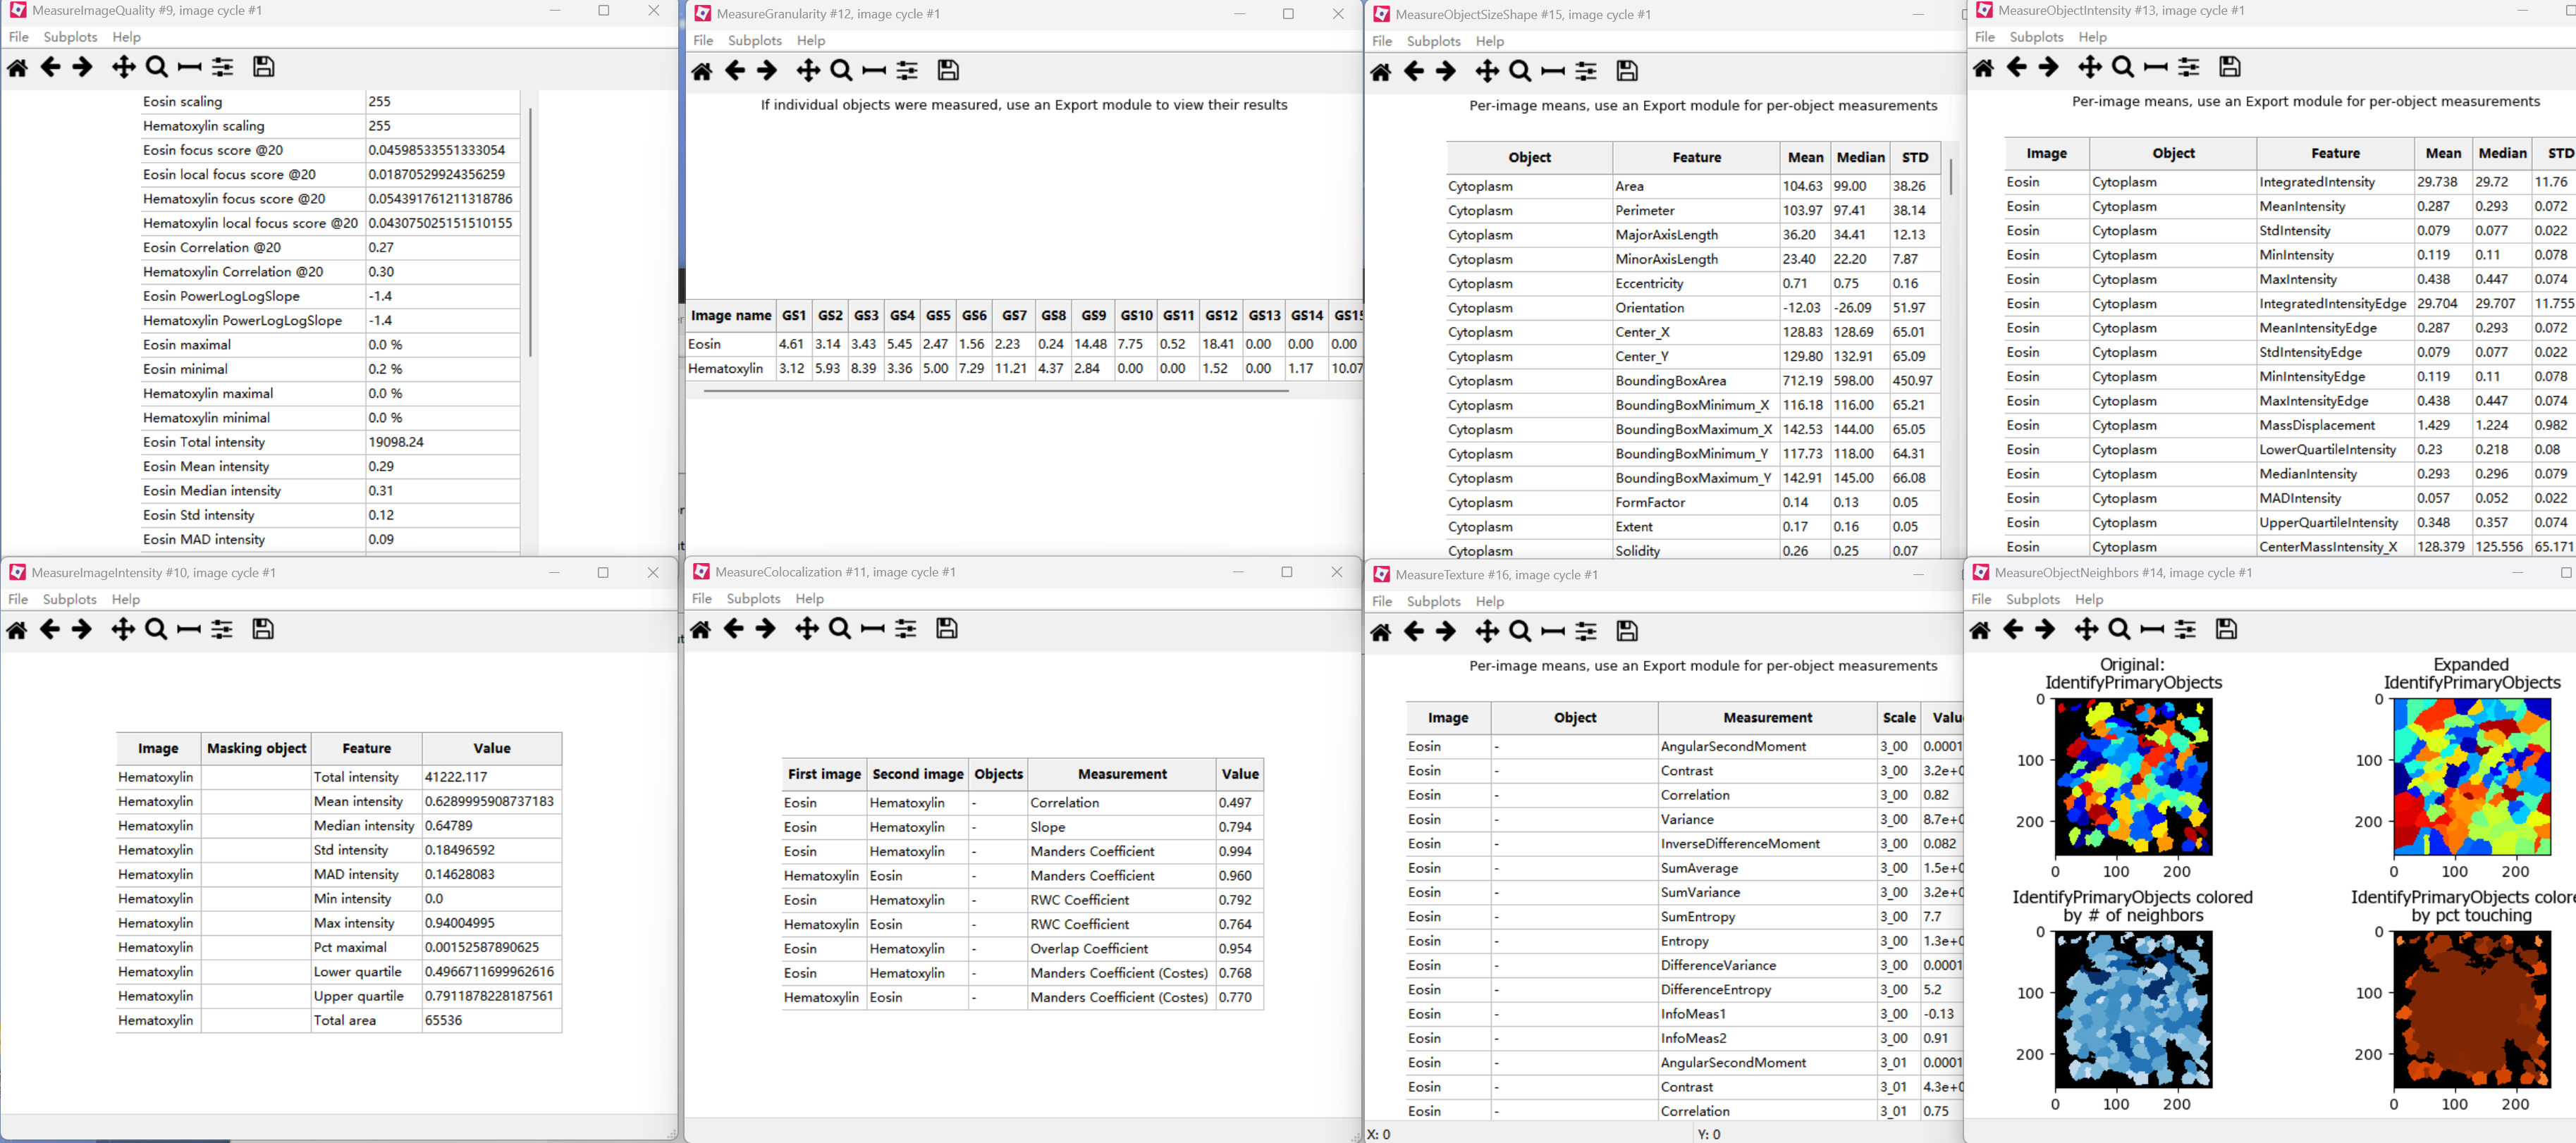
(3)输出文件:
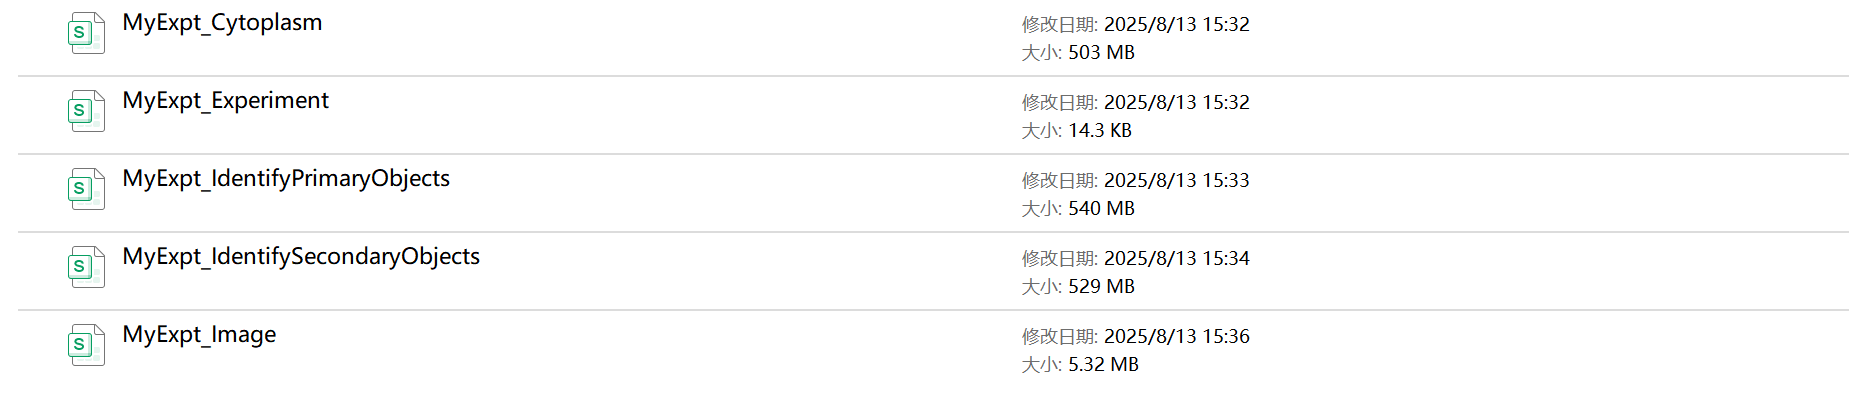
- MyExpt_Image:图像级别的全局特征,包括图像的,如平均亮度、标准差、纹理特征、图像中识别出的对象数量(如细胞总数、细胞核总数)。
- MyExpt_Experiment: 包含关于整个实验或整个批次运行的汇总统计数据和元数据
- MyExpt_IdentifyPrimaryObjects:包含了每个被识别出的细胞核的详细测量值。
- MyExpt_IdentifySecondaryObjects:指每个完整的细胞的详细测量值。它们通常是通过从主要对象(细胞核)向外扩展到细胞膜边界来识别的。
- MyExpt_Cytoplasm:包含了每个细胞的细胞质区域的详细测量值。细胞质通常是通过从次要对象(整个细胞)中减去主要对象(细胞核)来定义的。
Step2:合并为单个文件夹用于后面分析
import numpy as np
import pandas as pd
import os# 文件保存目录
indir = "./00.raw_data//"
print(indir)# 图像级别特征
infile = os.path.join(indir, "MyExpt_Image.csv")
print(infile)
df_image = pd.read_csv(infile)
prefixes = ['Correlation','Granularity','ImageQuality','Intensity','Texture','Threshold','FileName_HEslide','ImageNumber'
]# '^' 表示字符串的开头
# '|' 表示 '或' (OR)
# 我们将所有前缀用 '|' 连接起来,并用括号括起来,确保它们是作为一个整体进行 '或' 操作
regex_pattern = '^(' + '|'.join(prefixes) + ')'
print(f"生成的正则表达式: {regex_pattern}")
df_image = df_image.filter(regex=regex_pattern)
df_image = df_image.groupby([ 'FileName_HEslide',"ImageNumber"]).agg("mean").reset_index()
df_image.columns = ["image_" + i for i in df_image.columns]
df_image = df_image.rename({'image_ImageNumber':"ImageNumber",'image_FileName_HEslide':'FileName_HEslide'},axis=1)
df_image["case_id"] = df_image["FileName_HEslide"].str.split("_").str[0]
df_image.head(1)# 细胞核
infile = os.path.join(indir, "MyExpt_IdentifyPrimaryObjects.csv")
print(infile)df_Primary= pd.read_csv(infile)
prefixes = ['Texture','Neighbors','Location','Intensity','AreaShape','ObjectNumber','ImageNumber'
]
regex_pattern = '^(' + '|'.join(prefixes) + ')'
print(f"生成的正则表达式: {regex_pattern}")
df_Primary = df_Primary.filter(regex=regex_pattern)
df_Primary = df_Primary.groupby(["ImageNumber"]).agg("mean").reset_index()
df_Primary.columns = ["nucl_" + i for i in df_Primary.columns]
df_Primary = df_Primary.rename({'nucl_ImageNumber':"ImageNumber"},axis=1)
df_Primary.head(1)# 细胞
infile = os.path.join(indir, "MyExpt_IdentifySecondaryObjects.csv")
print(infile)df_Sec= pd.read_csv(infile)
prefixes = ['Texture','Location','Intensity','AreaShape','ObjectNumber','ImageNumber'
]
regex_pattern = '^(' + '|'.join(prefixes) + ')'
print(f"生成的正则表达式: {regex_pattern}")
df_Sec = df_Sec.filter(regex=regex_pattern)df_Sec = df_Sec.groupby(["ImageNumber"]).agg("mean").reset_index()
df_Sec.columns = ["cell_" + i for i in df_Sec.columns]
df_Sec = df_Sec.rename({'cell_ImageNumber':"ImageNumber"},axis=1)
df_Sec.head(1)# 细胞质
infile = os.path.join(indir, "MyExpt_Cytoplasm.csv")
print(infile)df_Cyto= pd.read_csv(infile)
prefixes = ['Texture', 'Location', 'Intensity', 'AreaShape','ObjectNumber','ImageNumber'
]
regex_pattern = '^(' + '|'.join(prefixes) + ')'
print(f"生成的正则表达式: {regex_pattern}")
df_Cyto = df_Cyto.filter(regex=regex_pattern)
df_Cyto = df_Cyto.groupby(["ImageNumber"]).agg("mean").reset_index()
df_Cyto.columns = ["cyto_" + i for i in df_Cyto.columns]
df_Cyto = df_Cyto.rename({'cyto_ImageNumber':"ImageNumber"},axis=1)
df_Cyto.head(1)# 特征合并
# ImageNumber 指 每个patch,每个ObjectNumber指每张patch上分割出来的核,细胞质等
df_m = pd.merge(df_image,df_Primary,how="inner",on = "ImageNumber")
df_m = pd.merge(df_m,df_Sec,how="inner",on = "ImageNumber")
df_m = pd.merge(df_m,df_Cyto,how="inner",on = "ImageNumber")
print(df_m.shape)
df_m.to_csv("Feature_byCellprofilers_BRAF.csv",index=False)
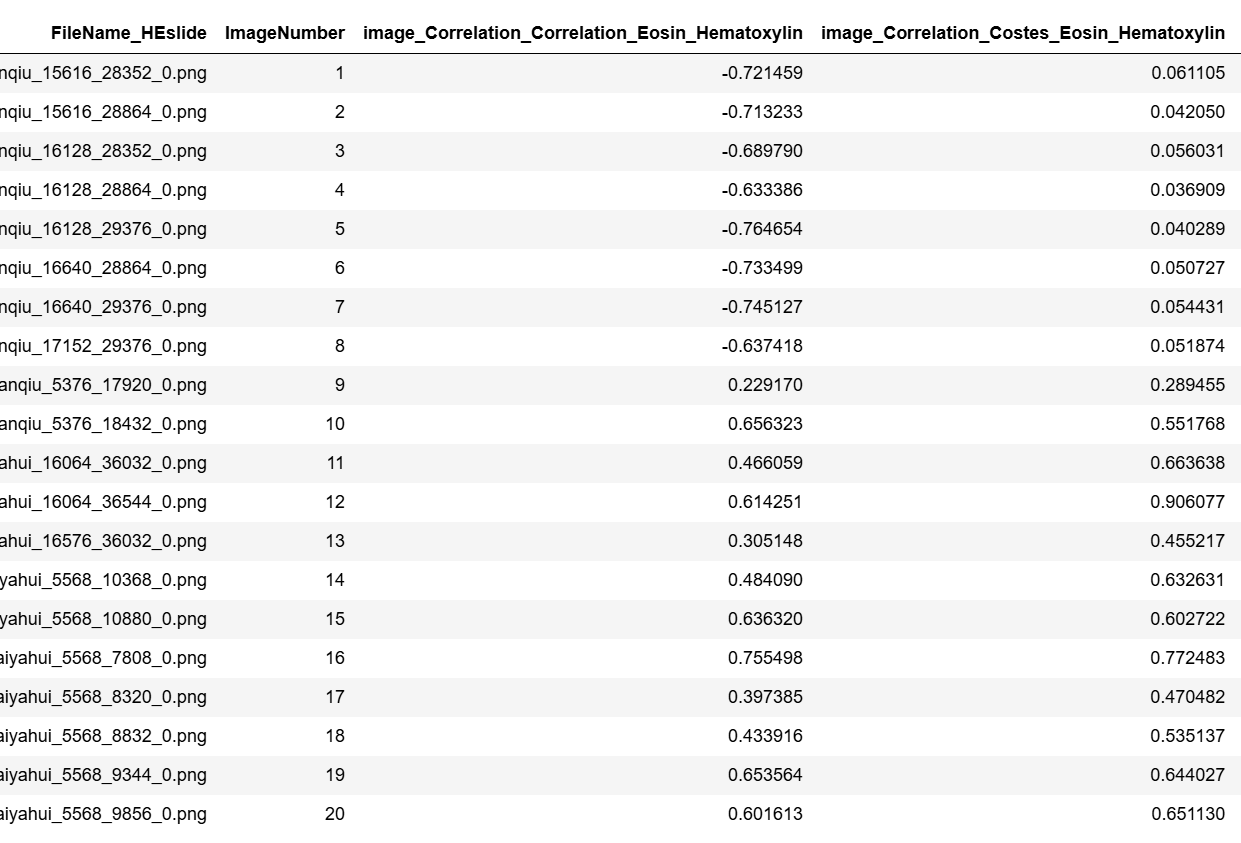
最后输出文件如下:
Step3:特征提取后处理
特征提取后处理流程1:病理学家标注ROI区域-> ROI patches (512 × 512 pixels) were tiled using OpenSlide -> color-normalized using the Vahadane method -> 50 non-overlapping representative patches that contained more tumor cells from each patient were selected for feature extraction -> The final value of each feature was averaged over 50 patches for each slide.
特征提取后处理流程2:The extracted features wereCellProfiler platform aggregated by mean, median, SD, 25-quantiles, and 75-quantiles of the values for the ROl in each slide. Intotal, 525 pathomics nucleus features (pNUC) features were generated for each patient.
三、一些其他pipeline参考(来于文献)
文献1: Development and interpretation of a pathomics-driven ensemble model for predicting the response to immunotherapy in gastric cancer
- Cellprofiler Pipeline: First, pathomics tumor nucleus features were extracted. After segmenting tumor nuclei using a HoVer-Net model for each ROI, we extracted three categories of pathomics nucleus features, including nuclear intensity, morphology, and texture features, using the “MeasureObjectIntensity”, “MeasureObject SizeShape”, and “Measure Texture” modules in the CellProfiler platform.
文献2: Clinical use of machine learning-based pathomics signature for diagnosis and survival prediction of bladder cancer https://onlinelibrary.wiley.com/doi/full/10.1111/cas.14927
-
Patch选择策略:Patch with 1000 × 1000 pixels
-
Cellprofiler Pipeline:We built an image processing pipeline (Document S1) for segmentation and feature extraction using multiple modules in CellProfiler. H&E-stained images were firstly unmixed with 1000 × 1000 pixels via the ‘UnmixColors’ module. Afterwards, unmixed images were automatically segmented via an ‘IdentifyPrimaryObjects’ module and an ‘IdentifySecondaryObjects’ module to identify the cell nuclei and cell cytoplasm. Quantitative image features of object shape, size, texture, and pixel intensity distribution were further extracted via multiple modules, including measure models of ‘Object Intensity Distribution’, ‘Object Intensity’, ‘Texture’, and ‘Object Size Shape’. After eliminating unnecessary image features, 345 available quantitative image features (Document S2) were finally selected for further analysis, which were also listed in Table S1.
文献3: Prognostic and predictive value of a pathomics signature in gastric cancer(IF:17)(https://www.ncbi.nlm.nih.gov/pmc/articles/PMC9653436
-
Patch选择策略: Ten nonoverlapping representative tiles of each case containing the greatest number of tumour cells with a field of view of 1000 × 1000 pixels (one pixel is equal to 0.504 μm) were selected by a pathologist and then confirmed by the other pathologist.
-
Cellprofiler Pipeline: The quantitative pathomics features of the selected tiles were extracted by using CellProfiler (version 4.0.7), an open-source image analysis software developed by the Broad Institute (Cambridge, MA). The H&E-stained images were split into haematoxylin-stained and eosin-stained greyscale images using the “UnmixColors” module. The H&E-stained images were also converted to greyscale images using the “ColorToGray” module based on the “Combine” method for further analysis. First, the features that indicated the image quality of the greyscale H&E, haematoxylin and eosin images were assessed by using the “MeasureImageQuality” and “MeasureImageIntensity” modules with three types of features, including blurred features, intensity features and threshold features. The threshold features were extracted by automatically calculating the threshold for each image to identify the tissue foreground from the unstained background with the Otsu algorithm. Subsequently, the colocalization and correlation between intensities in each haematoxylin-stained image and eosin-stained image were calculated on a pixel-by-pixel basis across an entire image by using the *“*MeasureColocalization” module. In addition, the granularity features of each image were assessed using the “MeasureGranularity” module, which outputted spectra of size measurements of the textures in the image, with a granular spectrum range of 16. Further description of the pipeline for feature extraction is described in the Supplementary Methods. A summary of the pathomics features is presented in Supplementary Table 15.