「日拱一码」058 机器学习——监督学习
目录
特点
类型
常见监督学习算法
代码示例
示例1:线性回归(回归问题)
示例2:逻辑回归(分类问题)
监督学习(Supervised Learning)是机器学习中最常见的一种学习方式,它通过已有的标记训练数据(即有输入和对应的正确输出)来训练模型,使模型能够预测新的未知数据的输出。
特点
- 有标记数据:训练数据包含输入特征和对应的正确输出标签
- 预测目标明确:模型学习输入到输出的映射关系
- 可评估性:可以通过测试数据评估模型性能
类型
- 分类(Classification):预测离散的类别标签
- 例如:垃圾邮件识别、图像分类、疾病诊断
- 回归(Regression):预测连续的数值输出
- 例如:房价预测、股票价格预测、温度预测
常见监督学习算法
- 线性回归(Linear Regression)
- 逻辑回归(Logistic Regression)
- 决策树(Decision Tree)
- 随机森林(Random Forest)
- 支持向量机(SVM)
- k近邻(KNN)
- 神经网络(Neural Networks)
代码示例
示例1:线性回归(回归问题)
# 导入必要的库
import numpy as np
from sklearn.linear_model import LinearRegression
from sklearn.model_selection import train_test_split
import matplotlib.pyplot as pltnp.random.seed(42)
X = np.random.rand(100, 1) * 10  # 100个0-10之间的随机数
y = 2 * X + 1 + np.random.randn(100, 1) * 2  # y = 2x + 1 + 噪声# 划分训练集和测试集
X_train, X_test, y_train, y_test = train_test_split(X, y, test_size=0.2, random_state=42)# 创建并训练模型
model = LinearRegression()
model.fit(X_train, y_train)# 预测和评估
y_pred = model.predict(X_test)
print(f"模型系数: {model.coef_}")
print(f"模型截距: {model.intercept_}")
print(f"R²分数: {model.score(X_test, y_test):.2f}")# 可视化
plt.rcParams['font.sans-serif'] = ['SimHei']
plt.rcParams['axes.unicode_minus'] = False
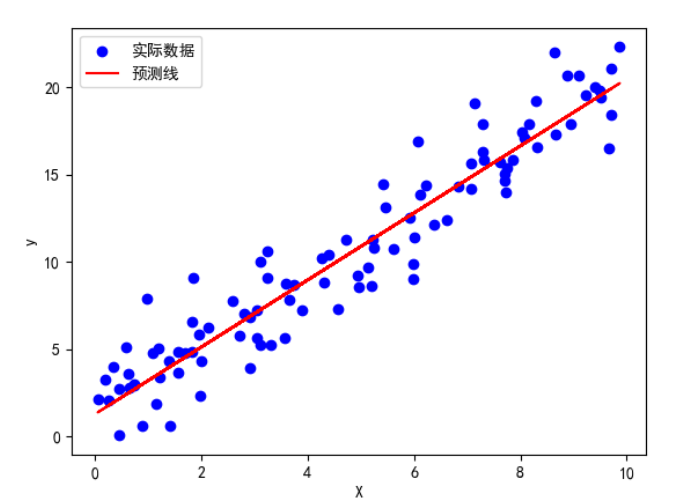
plt.scatter(X, y, color='blue', label='实际数据')
plt.plot(X, model.predict(X), color='red', label='预测线')
plt.xlabel('X')
plt.ylabel('y')
plt.legend()
plt.show()# 模型系数: [[1.91972946]]
# 模型截距: [1.28582664]
# R²分数: 0.93

示例2:逻辑回归(分类问题)
# 导入必要的库
from sklearn.datasets import load_iris
from sklearn.linear_model import LogisticRegression
from sklearn.model_selection import train_test_split
from sklearn.metrics import accuracy_score, confusion_matrix
import seaborn as sns
import numpy as np
import matplotlib.pyplot as pltdata = load_iris()
X = data.data[:, :2]  # 只使用前两个特征以便可视化
y = (data.target != 0).astype(int)  # 二分类问题:是否为setosa类# 划分训练集和测试集
X_train, X_test, y_train, y_test = train_test_split(X, y, test_size=0.3, random_state=42)# 创建并训练模型
model = LogisticRegression()
model.fit(X_train, y_train)# 预测和评估
y_pred = model.predict(X_test)
print(f"准确率: {accuracy_score(y_test, y_pred):.2f}")# 可视化决策边界和混淆矩阵
plt.rcParams['font.sans-serif'] = ['SimHei']
plt.rcParams['axes.unicode_minus'] = False
plt.figure(figsize=(12, 5))# 决策边界
plt.subplot(1, 2, 1)
x_min, x_max = X[:, 0].min() - 1, X[:, 0].max() + 1
y_min, y_max = X[:, 1].min() - 1, X[:, 1].max() + 1
xx, yy = np.meshgrid(np.arange(x_min, x_max, 0.02),np.arange(y_min, y_max, 0.02))
Z = model.predict(np.c_[xx.ravel(), yy.ravel()])
Z = Z.reshape(xx.shape)
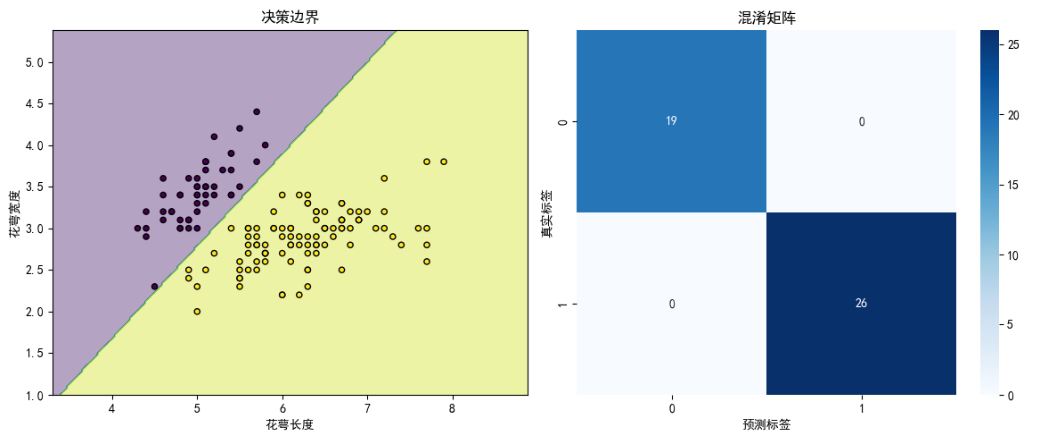
plt.contourf(xx, yy, Z, alpha=0.4)
plt.scatter(X[:, 0], X[:, 1], c=y, s=20, edgecolor='k')
plt.title('决策边界')
plt.xlabel('花萼长度')
plt.ylabel('花萼宽度')# 混淆矩阵
plt.subplot(1, 2, 2)
cm = confusion_matrix(y_test, y_pred)
sns.heatmap(cm, annot=True, fmt='d', cmap='Blues')
plt.title('混淆矩阵')
plt.xlabel('预测标签')
plt.ylabel('真实标签')plt.tight_layout()
plt.show()# 准确率: 1.00
