ELK日志分析部署(小白的“升级打怪”成长之路)
目录
一、Elasticsearch+Logstash+Filebeat单机部署
1、修改主机名、关闭安全上下文
2、对时
3、安装elasticsearch、filebeat、kibana、logstash服务
4、修改配置文件
5、开启服务
6、测试logstash服务的数据传输,输入1、2、3测试内容
7、网站访问
二、Elasticsearch+Logstash+Filebeat+Kibana四机部署
1、修改主机名、关闭安全上下文
2、对时
3、添加主机名解析
4、安装服务
5、修改配置文件
6、启动服务
7、网站访问
看到感觉有帮助的朋友,劳烦动动发财的小手给博主点个赞
一、Elasticsearch+Logstash+Filebeat单机部署
操作前准备一台主机
1、修改主机名、关闭安全上下文
[root@bogon ~]# hostnamectl set-hostname elk [root@bogon ~]# bash [root@elk ~]# systemctl stop firewalld.service [root@elk ~]# setenforce 0
2、对时
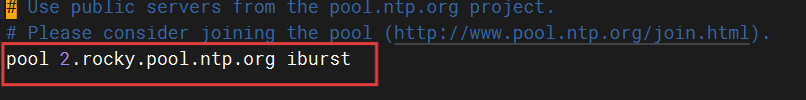
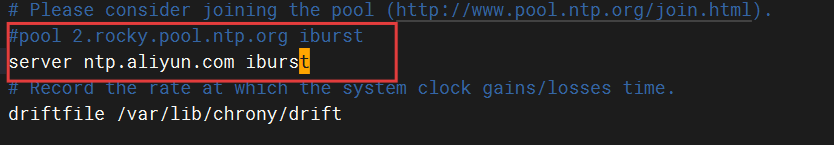
[root@elk ~]# timedatectl set-timezone Asia/Shanghai [root@elk ~]# vim /etc/chrony.conf ##修改对时服务 #pool 2.rocky.pool.ntp.org iburst server ntp.aliyun.com iburst [root@elk ~]# systemctl restart chronyd
修改前
修改后

[root@elk ~]# date
2025年 07月 17日 星期四 09:51:09 CST
3、安装elasticsearch、filebeat、kibana、logstash服务
把下载好的elfk服务安装
[root@elk ~]# yum install -y lrzsz [root@elk ~]# cd /opt [root@elk opt]# ls [root@elk opt]# rz rz waiting to receive.**[root@elk opt]# ls elfk.tar.gz [root@elk opt]# tar xf elfk.tar.gz [root@elk opt]# ls elfk.tar.gz rpm [root@elk opt]# cd rpm [root@elk rpm]# ls elasticsearch-7.1.1-x86_64.rpm filebeat-7.1.1-x86_64.rpm kibana-7.1.1-x86_64.rpm logstash-7.1.1.rpm [root@elk rpm]# yum localinstall -y elasticsearch-7.1.1-x86_64.rpm [root@elk rpm]# yum localinstall -y filebeat-7.1.1-x86_64.rpm [root@elk rpm]# yum localinstall -y kibana-7.1.1-x86_64.rpm [root@elk rpm]# yum localinstall -y logstash-7.1.1.rpm
4、修改配置文件
[root@elk rpm]# vim /etc/hosts
#加入以下本主机主机名解析
192.168.58.161  elk
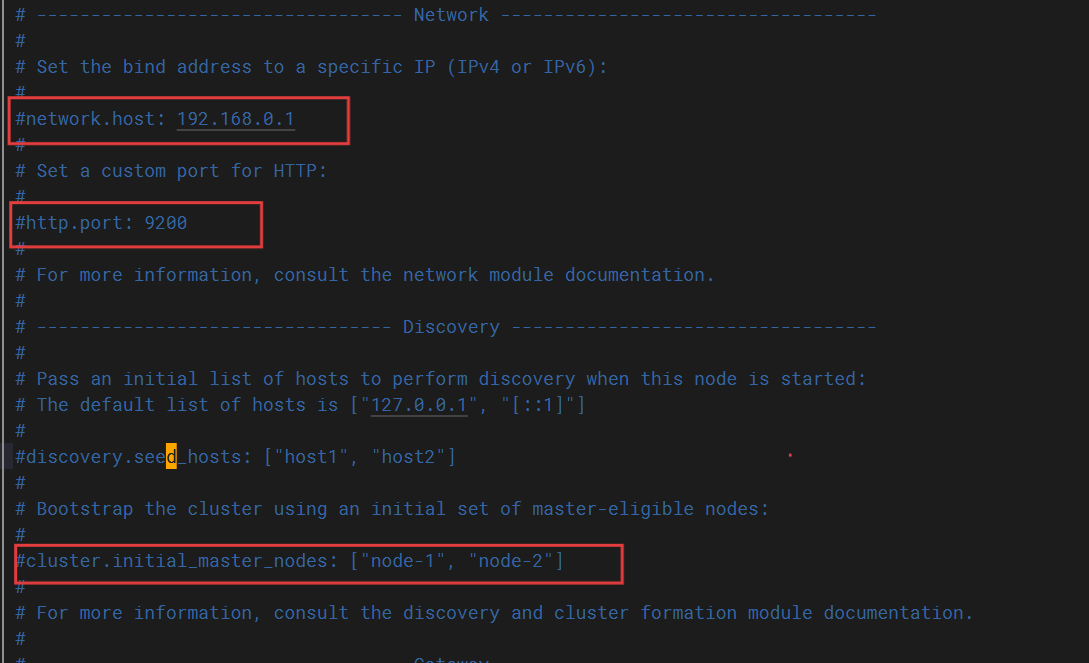
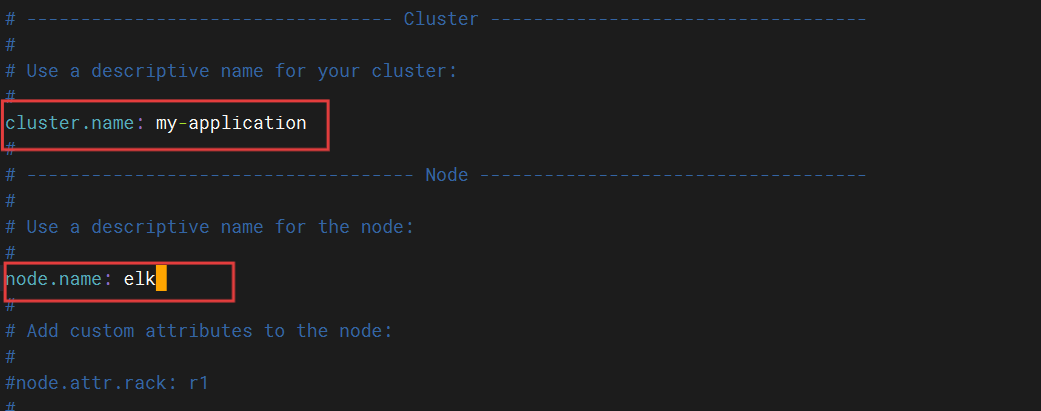
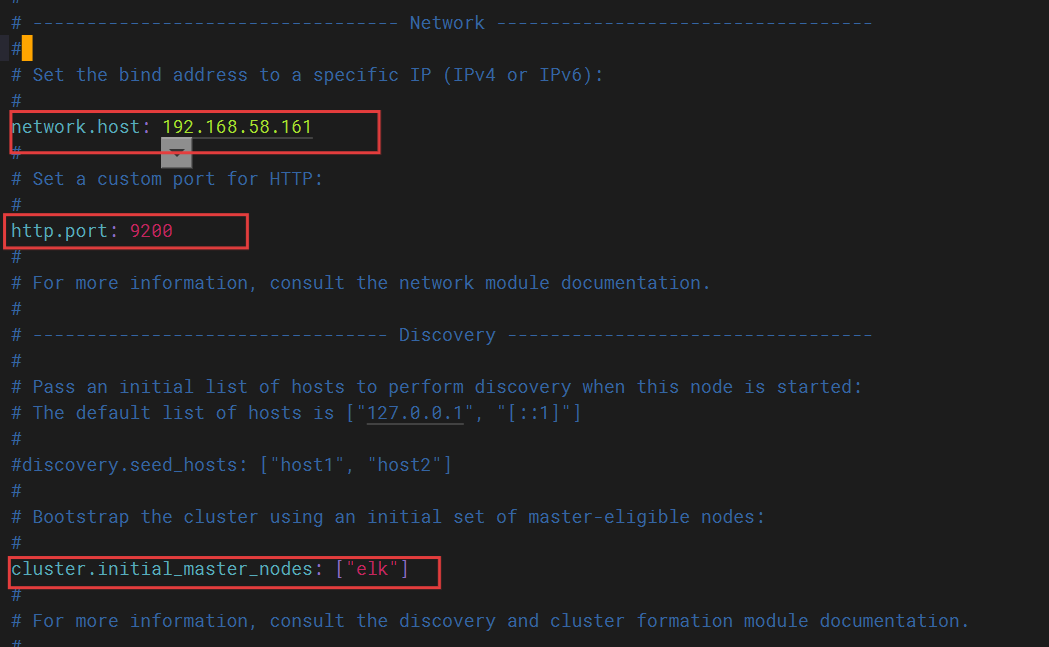
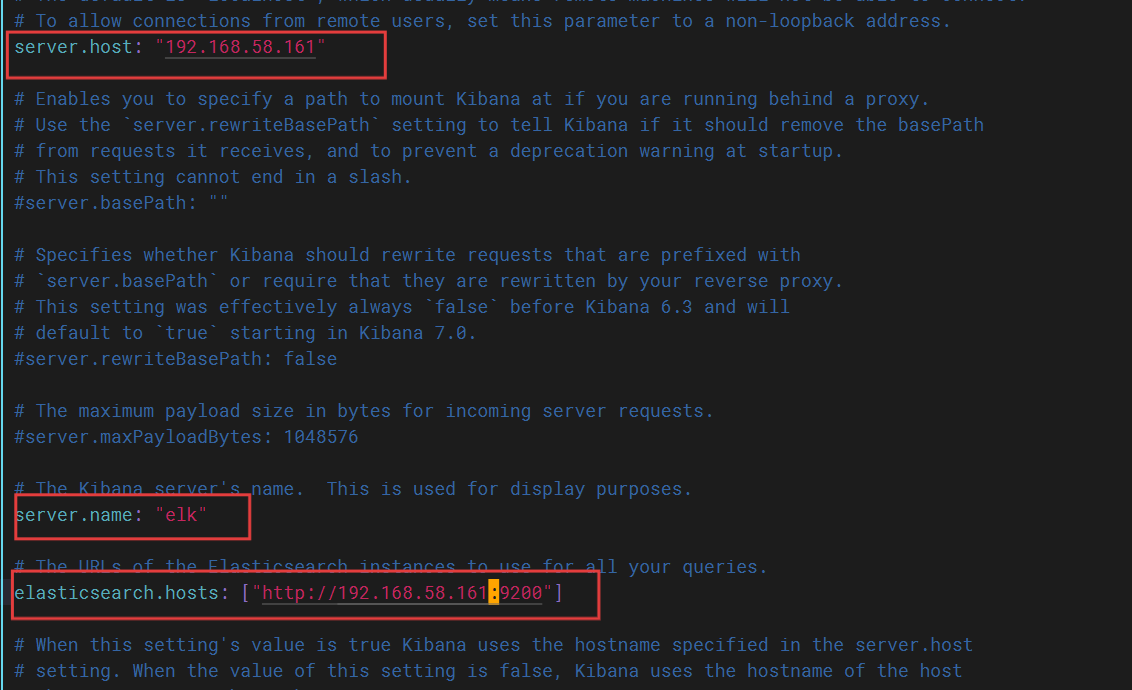
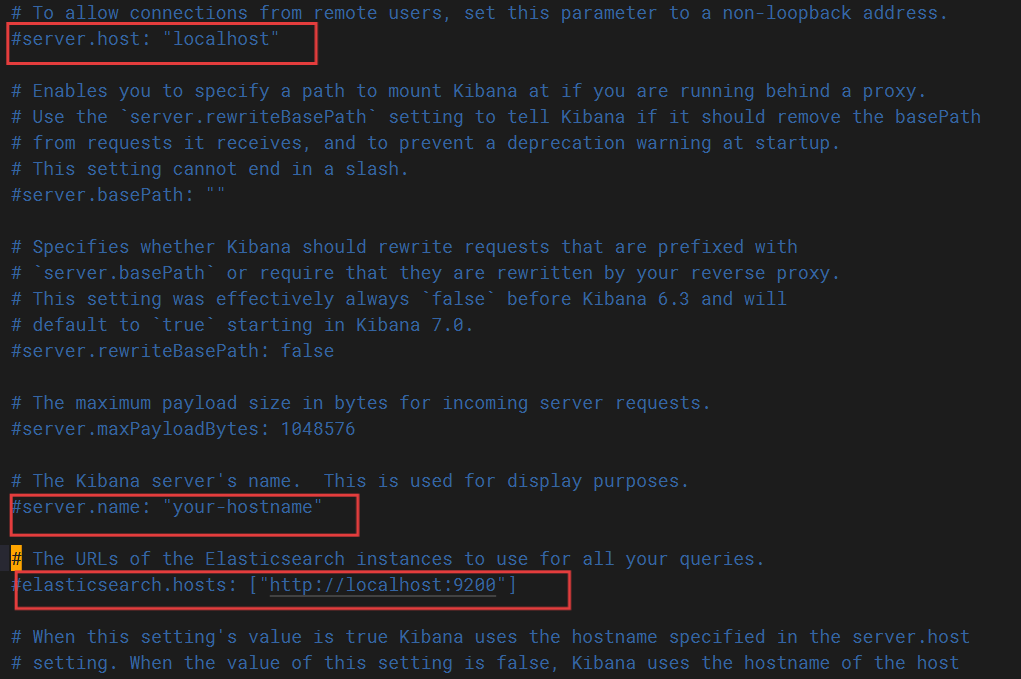
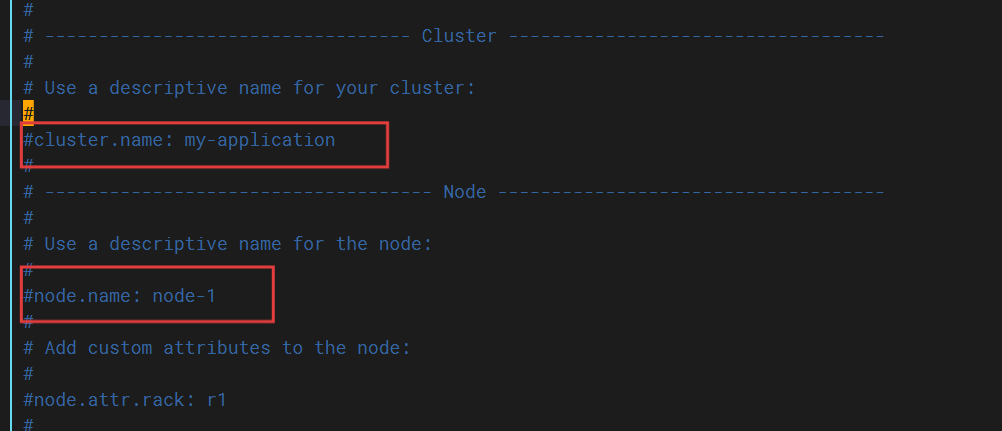
[root@elk rpm]# cd /etc/elasticsearch/
[root@elk elasticsearch]# ls
elasticsearch.keystore  elasticsearch.yml  jvm.options  log4j2.properties  role_mapping.yml  roles.yml  users  users_roles
[root@elk elasticsearch]# vim elasticsearch.yml
修改前

修改后
[root@elk elasticsearch]# cd /etc/logstash/conf.d/
[root@elk conf.d]# ls
##创建配置文件
[root@elk conf.d]# vim pipline.conf
#输入部分
input {file {path => "/var/log/messages" # 监控的日志文件路径start_position => "beginning" # 从文件开头读取(默认为"end")}
}
#输出部分
output {elasticsearch {hosts => ["http://192.168.58.160:9200"] # Elasticsearch 地址index => "system-log-%{+YYYY.MM.dd}" # 按日期命名的索引}
#日志进行标准输出,观察日志获取的过程stdout {codec => rubydebug # 打印格式化日志到控制台}
}
#rubydebug 是 Logstash 的一种输出编解码器(codec),主要用于调试和开发阶段,它会将事件(Event)以美观的、格式化的 Ruby Hash 形式打印到标准输出#(stdout)
##命令优化
[root@elk conf.d]# ln -s /usr/share/logstash/bin//logstash /usr/local/bin
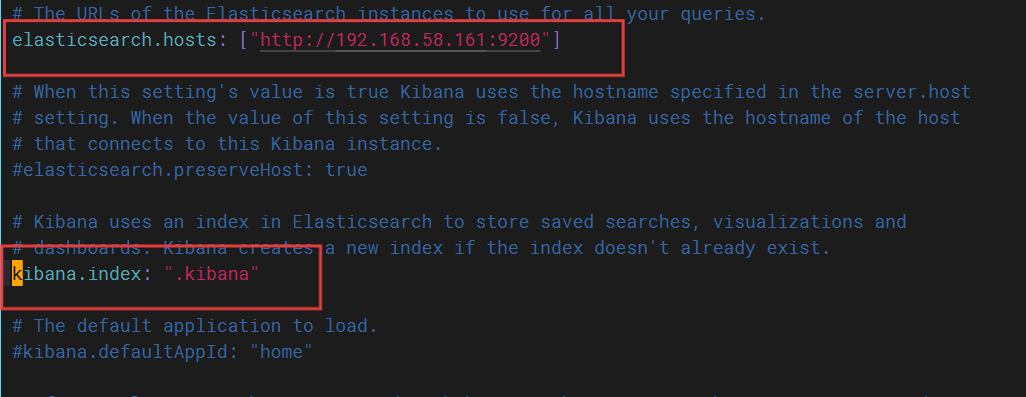
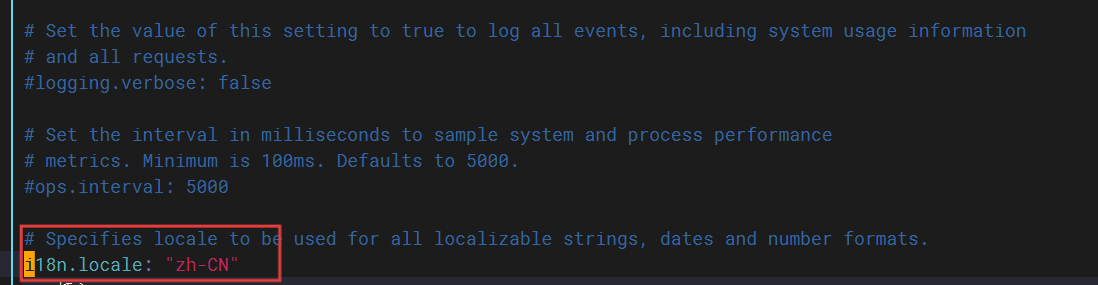
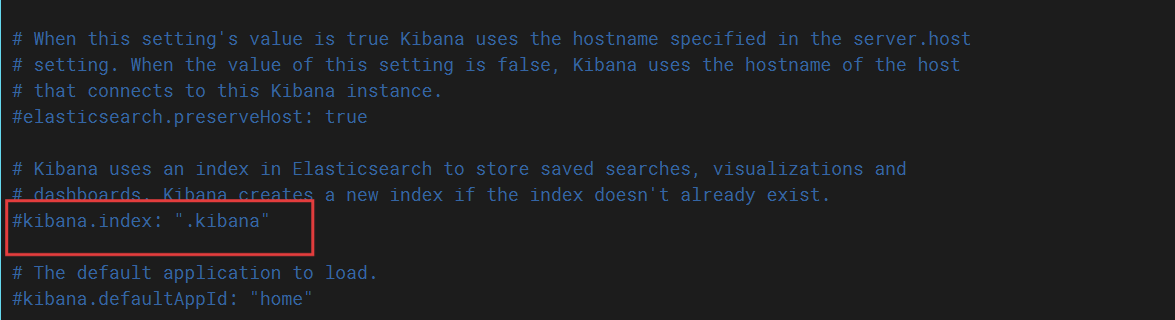
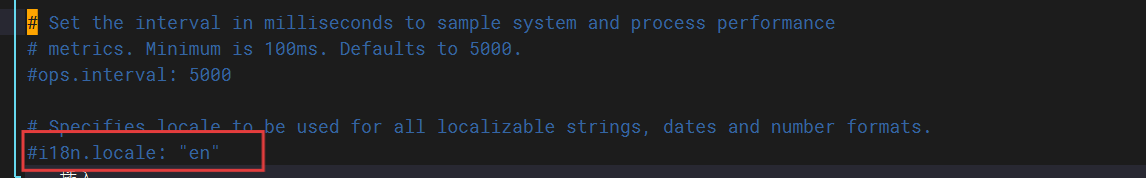
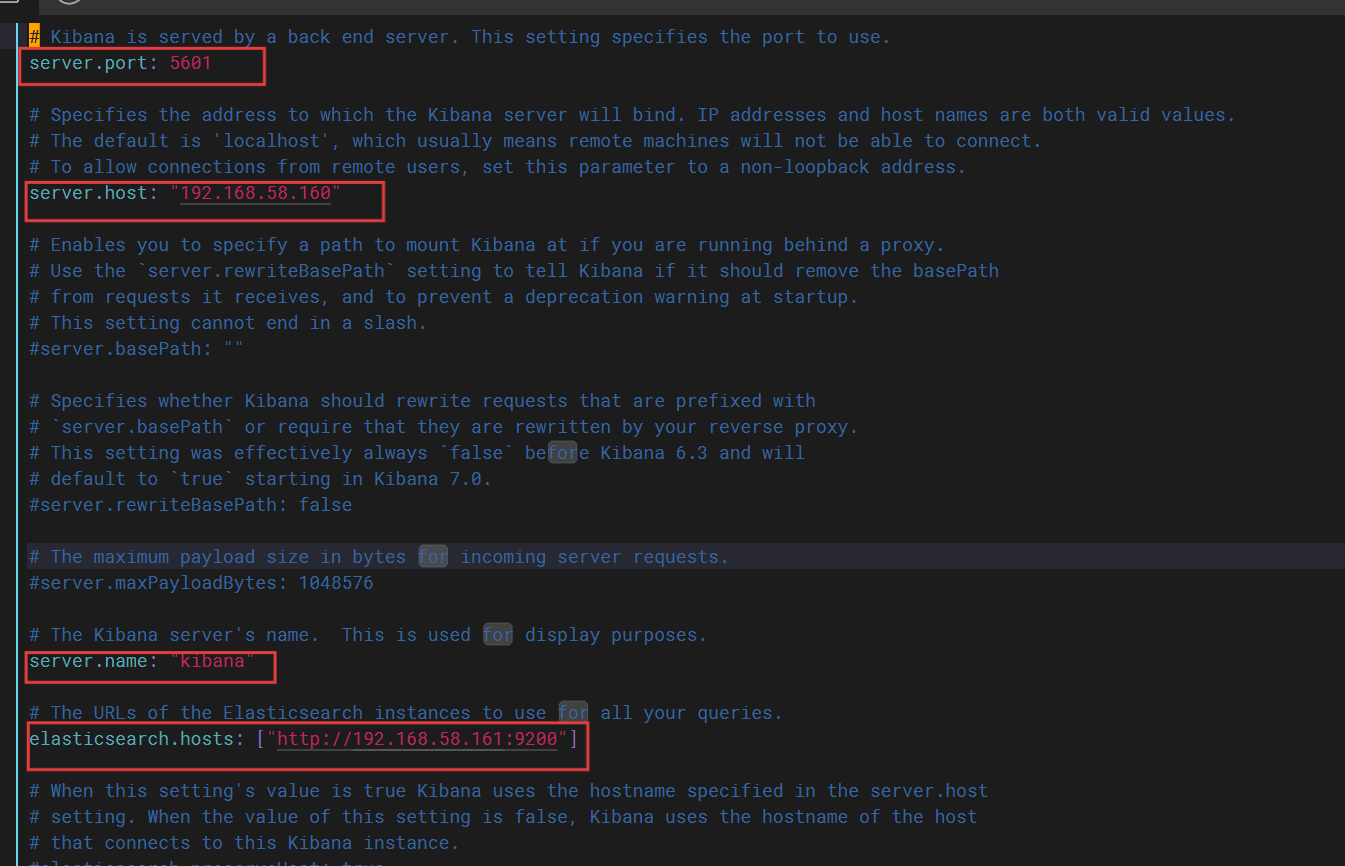
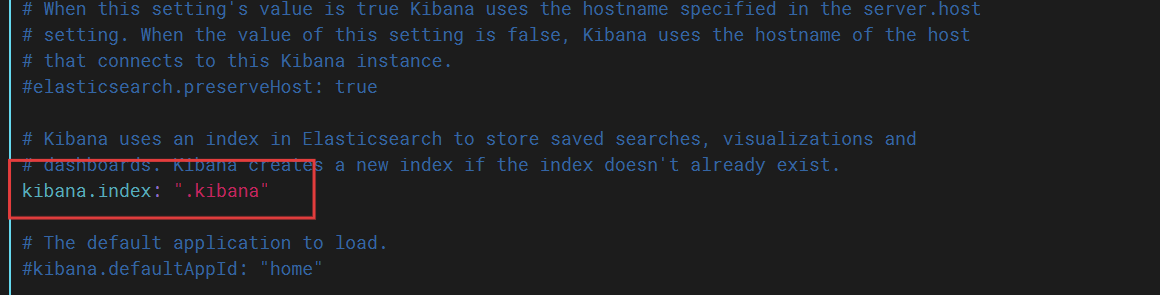
[root@elk conf.d]# cd /etc/kibana/
[root@elk kibana]# ls
kibana.yml
[root@elk kibana]# vim kibana.yml
修改前


修改后
5、开启服务
[root@elk kibana]# systemctl start elasticsearch.service [root@elk kibana]# netstat -anptu | grep java [root@elk kibana]# netstat -anptu | grep java tcp6 0 0 192.168.58.161:9200 :::* LISTEN 11358/java tcp6 0 0 192.168.58.161:9300 :::* LISTEN 11358/java [root@elk kibana]# systemctl start kibana [root@elk kibana]# netstat -anptu | grep node tcp 0 0 192.168.58.161:5601 0.0.0.0:* LISTEN 11628/node
6、测试logstash服务的数据传输,输入1、2、3测试内容
##使用rubydebug解码
[root@elk kibana]# logstash -e 'input { stdin{} } output { stdout{ codec=>rubydebug }}'
WARNING: Could not find logstash.yml which is typically located in $LS_HOME/config or /etc/logstash. You can specify the path using --path.settings. Continuing using the defaults
Could not find log4j2 configuration at path /usr/share/logstash/config/log4j2.properties. Using default config which logs errors to the console
[INFO ] 2025-07-17 10:40:54.233 [main] writabledirectory - Creating directory {:setting=>"path.queue", :path=>"/usr/share/logstash/data/queue"}
[INFO ] 2025-07-17 10:40:54.277 [main] writabledirectory - Creating directory {:setting=>"path.dead_letter_queue", :path=>"/usr/share/logstash/data/dead_letter_queue"}
[WARN ] 2025-07-17 10:40:55.382 [LogStash::Runner] multilocal - Ignoring the 'pipelines.yml' file because modules or command line options are specified
[INFO ] 2025-07-17 10:40:55.404 [LogStash::Runner] runner - Starting Logstash {"logstash.version"=>"7.1.1"}
[INFO ] 2025-07-17 10:40:55.482 [LogStash::Runner] agent - No persistent UUID file found. Generating new UUID {:uuid=>"c718e41a-5a11-4310-a4cf-424a565f2a3d", :path=>"/usr/share/logstash/data/uuid"}
[INFO ] 2025-07-17 10:41:09.297 [[main]-pipeline-manager] javapipeline - Starting pipeline {:pipeline_id=>"main", "pipeline.workers"=>2, "pipeline.batch.size"=>125, "pipeline.batch.delay"=>50, "pipeline.max_inflight"=>250, :thread=>"#<Thread:0x432511fb run>"}
[INFO ] 2025-07-17 10:41:09.554 [[main]-pipeline-manager] javapipeline - Pipeline started {"pipeline.id"=>"main"}
The stdin plugin is now waiting for input:
[INFO ] 2025-07-17 10:41:09.836 [Ruby-0-Thread-1: /usr/share/logstash/lib/bootstrap/environment.rb:6] agent - Pipelines running {:count=>1, :running_pipelines=>[:main], :non_running_pipelines=>[]}
[INFO ] 2025-07-17 10:41:10.836 [Api Webserver] agent - Successfully started Logstash API endpoint {:port=>9600}
1
/usr/share/logstash/vendor/bundle/jruby/2.5.0/gems/awesome_print-1.7.0/lib/awesome_print/formatters/base_formatter.rb:31: warning: constant ::Fixnum is deprecated
{"@version" => "1","@timestamp" => 2025-07-17T02:41:14.051Z,"message" => "1","host" => "elk"
}
2
{"@version" => "1","@timestamp" => 2025-07-17T02:41:16.695Z,"message" => "2","host" => "elk"
}
3
{"@version" => "1","@timestamp" => 2025-07-17T02:41:19.444Z,"message" => "3","host" => "elk"
}
^C[WARN ] 2025-07-17 10:41:23.088 [SIGINT handler] runner - SIGINT received. Shutting down.
[INFO ] 2025-07-17 10:41:23.545 [Converge PipelineAction::Stop<main>] javapipeline - Pipeline terminated {"pipeline.id"=>"main"}
[INFO ] 2025-07-17 10:41:23.556 [LogStash::Runner] runner - Logstash shut down.
##输出到elasticsearch服务
[root@elk kibana]# logstash -e 'input { stdin{} } output { elasticsearch{ hosts=>["192.168.58.161:9200"]} }'
WARNING: Could not find logstash.yml which is typically located in $LS_HOME/config or /etc/logstash. You can specify the path using --path.settings. Continuing using the defaults
Could not find log4j2 configuration at path /usr/share/logstash/config/log4j2.properties. Using default config which logs errors to the console
[WARN ] 2025-07-17 10:43:10.758 [LogStash::Runner] multilocal - Ignoring the 'pipelines.yml' file because modules or command line options are specified
[INFO ] 2025-07-17 10:43:10.794 [LogStash::Runner] runner - Starting Logstash {"logstash.version"=>"7.1.1"}
[INFO ] 2025-07-17 10:43:24.296 [[main]-pipeline-manager] elasticsearch - Elasticsearch pool URLs updated {:changes=>{:removed=>[], :added=>[http://192.168.58.161:9200/]}}
[WARN ] 2025-07-17 10:43:24.803 [[main]-pipeline-manager] elasticsearch - Restored connection to ES instance {:url=>"http://192.168.58.161:9200/"}
[INFO ] 2025-07-17 10:43:25.499 [[main]-pipeline-manager] elasticsearch - ES Output version determined {:es_version=>7}
[WARN ] 2025-07-17 10:43:25.507 [[main]-pipeline-manager] elasticsearch - Detected a 6.x and above cluster: the `type` event field won't be used to determine the document _type {:es_version=>7}
[INFO ] 2025-07-17 10:43:25.607 [[main]-pipeline-manager] elasticsearch - New Elasticsearch output {:class=>"LogStash::Outputs::ElasticSearch", :hosts=>["//192.168.58.161:9200"]}
[INFO ] 2025-07-17 10:43:25.650 [Ruby-0-Thread-5: :1] elasticsearch - Using default mapping template
[INFO ] 2025-07-17 10:43:25.700 [[main]-pipeline-manager] javapipeline - Starting pipeline {:pipeline_id=>"main", "pipeline.workers"=>2, "pipeline.batch.size"=>125, "pipeline.batch.delay"=>50, "pipeline.max_inflight"=>250, :thread=>"#<Thread:0x4c0af2db run>"}
[INFO ] 2025-07-17 10:43:26.052 [[main]-pipeline-manager] javapipeline - Pipeline started {"pipeline.id"=>"main"}
The stdin plugin is now waiting for input:
[INFO ] 2025-07-17 10:43:26.440 [Ruby-0-Thread-1: /usr/share/logstash/lib/bootstrap/environment.rb:6] agent - Pipelines running {:count=>1, :running_pipelines=>[:main], :non_running_pipelines=>[]}
[INFO ] 2025-07-17 10:43:26.458 [Ruby-0-Thread-5: :1] elasticsearch - Attempting to install template {:manage_template=>{"index_patterns"=>"logstash-*", "version"=>60001, "settings"=>{"index.refresh_interval"=>"5s", "number_of_shards"=>1, "index.lifecycle.name"=>"logstash-policy", "index.lifecycle.rollover_alias"=>"logstash"}, "mappings"=>{"dynamic_templates"=>[{"message_field"=>{"path_match"=>"message", "match_mapping_type"=>"string", "mapping"=>{"type"=>"text", "norms"=>false}}}, {"string_fields"=>{"match"=>"*", "match_mapping_type"=>"string", "mapping"=>{"type"=>"text", "norms"=>false, "fields"=>{"keyword"=>{"type"=>"keyword", "ignore_above"=>256}}}}}], "properties"=>{"@timestamp"=>{"type"=>"date"}, "@version"=>{"type"=>"keyword"}, "geoip"=>{"dynamic"=>true, "properties"=>{"ip"=>{"type"=>"ip"}, "location"=>{"type"=>"geo_point"}, "latitude"=>{"type"=>"half_float"}, "longitude"=>{"type"=>"half_float"}}}}}}}
[INFO ] 2025-07-17 10:43:26.516 [Ruby-0-Thread-5: :1] elasticsearch - Installing elasticsearch template to _template/logstash
[INFO ] 2025-07-17 10:43:26.896 [Ruby-0-Thread-5: :1] elasticsearch - Creating rollover alias <logstash-{now/d}-000001>
[INFO ] 2025-07-17 10:43:27.437 [Ruby-0-Thread-5: :1] elasticsearch - Installing ILM policy {"policy"=>{"phases"=>{"hot"=>{"actions"=>{"rollover"=>{"max_size"=>"50gb", "max_age"=>"30d"}}}}}} to _ilm/policy/logstash-policy
[INFO ] 2025-07-17 10:43:28.210 [Api Webserver] agent - Successfully started Logstash API endpoint {:port=>9600}
test
^C[WARN ] 2025-07-17 10:43:55.860 [SIGINT handler] runner - SIGINT received. Shutting down.
[INFO ] 2025-07-17 10:43:56.313 [Converge PipelineAction::Stop<main>] javapipeline - Pipeline terminated {"pipeline.id"=>"main"}
[INFO ] 2025-07-17 10:43:56.674 [LogStash::Runner] runner - Logstash shut down.
[root@elk kibana]# logstash -f /etc/logstash/conf.d/pipline.conf
WARNING: Could not find logstash.yml which is typically located in $LS_HOME/config or /etc/logstash. You can specify the path using --path.settings. Continuing using the defaults
Could not find log4j2 configuration at path /usr/share/logstash/config/log4j2.properties. Using default config which logs errors to the console
[WARN ] 2025-07-17 10:44:53.525 [LogStash::Runner] multilocal - Ignoring the 'pipelines.yml' file because modules or command line options are specified
[INFO ] 2025-07-17 10:44:53.549 [LogStash::Runner] runner - Starting Logstash {"logstash.version"=>"7.1.1"}
[INFO ] 2025-07-17 10:45:06.345 [[main]-pipeline-manager] elasticsearch - Elasticsearch pool URLs updated {:changes=>{:removed=>[], :added=>[http://192.168.58.161:9200/]}}
[WARN ] 2025-07-17 10:45:06.907 [[main]-pipeline-manager] elasticsearch - Restored connection to ES instance {:url=>"http://192.168.58.161:9200/"}
[INFO ] 2025-07-17 10:45:07.272 [[main]-pipeline-manager] elasticsearch - ES Output version determined {:es_version=>7}
[WARN ] 2025-07-17 10:45:07.278 [[main]-pipeline-manager] elasticsearch - Detected a 6.x and above cluster: the `type` event field won't be used to determine the document _type {:es_version=>7}
[INFO ] 2025-07-17 10:45:07.330 [[main]-pipeline-manager] elasticsearch - New Elasticsearch output {:class=>"LogStash::Outputs::ElasticSearch", :hosts=>["http://192.168.58.161:9200"]}
[INFO ] 2025-07-17 10:45:07.378 [Ruby-0-Thread-5: :1] elasticsearch - Using default mapping template
[INFO ] 2025-07-17 10:45:07.389 [[main]-pipeline-manager] javapipeline - Starting pipeline {:pipeline_id=>"main", "pipeline.workers"=>2, "pipeline.batch.size"=>125, "pipeline.batch.delay"=>50, "pipeline.max_inflight"=>250, :thread=>"#<Thread:0x40b7f892 run>"}
[INFO ] 2025-07-17 10:45:07.704 [Ruby-0-Thread-5: :1] elasticsearch - Attempting to install template {:manage_template=>{"index_patterns"=>"logstash-*", "version"=>60001, "settings"=>{"index.refresh_interval"=>"5s", "number_of_shards"=>1}, "mappings"=>{"dynamic_templates"=>[{"message_field"=>{"path_match"=>"message", "match_mapping_type"=>"string", "mapping"=>{"type"=>"text", "norms"=>false}}}, {"string_fields"=>{"match"=>"*", "match_mapping_type"=>"string", "mapping"=>{"type"=>"text", "norms"=>false, "fields"=>{"keyword"=>{"type"=>"keyword", "ignore_above"=>256}}}}}], "properties"=>{"@timestamp"=>{"type"=>"date"}, "@version"=>{"type"=>"keyword"}, "geoip"=>{"dynamic"=>true, "properties"=>{"ip"=>{"type"=>"ip"}, "location"=>{"type"=>"geo_point"}, "latitude"=>{"type"=>"half_float"}, "longitude"=>{"type"=>"half_float"}}}}}}}
[INFO ] 2025-07-17 10:45:08.521 [[main]-pipeline-manager] file - No sincedb_path set, generating one based on the "path" setting {:sincedb_path=>"/usr/share/logstash/data/plugins/inputs/file/.sincedb_452905a167cf4509fd08acb964fdb20c", :path=>["/var/log/messages"]}
[INFO ] 2025-07-17 10:45:08.631 [[main]-pipeline-manager] javapipeline - Pipeline started {"pipeline.id"=>"main"}
[INFO ] 2025-07-17 10:45:08.916 [Ruby-0-Thread-1: /usr/share/logstash/lib/bootstrap/environment.rb:6] agent - Pipelines running {:count=>1, :running_pipelines=>[:main], :non_running_pipelines=>[]}
[INFO ] 2025-07-17 10:45:09.036 [[main]<file] observingtail - START, creating Discoverer, Watch with file and sincedb collections
[INFO ] 2025-07-17 10:45:10.784 [Api Webserver] agent - Successfully started Logstash API endpoint {:port=>9600}
/usr/share/logstash/vendor/bundle/jruby/2.5.0/gems/awesome_print-1.7.0/lib/awesome_print/formatters/base_formatter.rb:31: warning: constant ::Fixnum is deprecated
{"path" => "/var/log/messages","@version" => "1","@timestamp" => 2025-07-17T02:45:11.604Z,"host" => "elk","message" => "Jul 16 08:12:10 bogon journal[3707]: unable to get EDID for xrandr-Virtual-1: unable to get EDID for output"
}
{"path" => "/var/log/messages","@version" => "1","@timestamp" => 2025-07-17T02:45:11.719Z,"host" => "elk","message" => "Jul 16 08:12:13 bogon NetworkManager[1496]: <info> [1752667933.3361] agent-manager: agent[a62b888385390367,:1.66/org.gnome.Shell.NetworkAgent/42]: agent registered"
}
{"path" => "/var/log/messages","@version" => "1","@timestamp" => 2025-07-17T02:45:11.720Z,"host" => "elk","message" => "Jul 16 08:12:17 bogon dbus-daemon[976]: [system] Activating via systemd: service name='net.reactivated.Fprint' unit='fprintd.service' requested by ':1.66' (uid=42 pid=2326 comm=\"/usr/bin/gnome-shell \" label=\"system_u:system_r:xdm_t:s0-s0:c0.c1023\")"
}
7、网站访问
网站访问192.168.58.161:5601


二、Elasticsearch+Logstash+Filebeat+Kibana四机部署
操作前准备四台主机(ip为192.168.58.160、192.168.58.161、192.168.58.162、192.168.58.163)
1、修改主机名、关闭安全上下文
####192.168.58.160 [root@bogon ~]# hostnamectl set-hostname kibana [root@bogon ~]# bash [root@kibana ~]# systemctl stop firewalld.service [root@kibana ~]# setenforce 0
####192.168.58.161
[root@bogon ~]# hostnamectl set-hostname es
[root@bogon ~]# bash
[root@es ~]# systemctl stop firewalld.service
[root@es ~]# setenforce 0
####192.168.58.162
[root@bogon ~]# hostnamectl set-hostname logstash
[root@bogon ~]# bash
[root@logstash ~]# systemctl stop firewalld.service
[root@logstash ~]# setenforce 0
####192.168.58.163
[root@bogon ~]# hostnamectl set-hostname web1
[root@bogon ~]# bash
[root@web1 ~]# systemctl stop firewalld.service
[root@web1 ~]# setenforce 0
2、对时
####192.168.58.160 [root@kibana ~]# timedatectl set-timezone Asia/Shanghai [root@kibana ~]# vim /etc/chrony.conf ##修改对时服务 #pool 2.rocky.pool.ntp.org iburst server ntp.aliyun.com iburst [root@kibana ~]# systemctl restart chronyd
修改前

修改后
其他三台主机同样配置对时
3、添加主机名解析
####192.168.58.160 [root@kibana ~]# vim /etc/hosts #加入以下本主机主机名解析 192.168.58.160 kibana 192.168.58.161 es 192.168.58.162 logstash
####192.168.58.161 [root@es ~]# vim /etc/hosts #加入以下本主机主机名解析 192.168.58.160 kibana 192.168.58.161 es 192.168.58.162 logstash
####192.168.58.162 [root@logstash ~]# vim /etc/hosts #加入以下本主机主机名解析 192.168.58.160 kibana 192.168.58.161 es 192.168.58.162 logstash
4、安装服务
192.168.58.160安装 kibana服务
[root@kibana ~]# yum install -y lrzsz
[root@kibana ~]# rz
rz waiting to receive.**[root@kibana ~]# ls
公共  模板  视频  图片  文档  下载  音乐  桌面  anaconda-ks.cfg  initial-setup-ks.cfg  kibana-7.1.1-x86_64.rpm
[root@kibana ~]# yum localinstall -y kibana-7.1.1-x86_64.rpm
192.168.58.161安装elasticsearch服务
[root@es ~]# yum install -y lrzsz
[root@es ~]# rz
rz waiting to receive.**[root@es ~]# ls
公共  模板  视频  图片  文档  下载  音乐  桌面  anaconda-ks.cfg  elasticsearch-7.1.1-x86_64.rpm  initial-setup-ks.cfg
[root@es ~]# yum localinstall -y elasticsearch-7.1.1-x86_64.rpm
192.168.58.162安装 logstash服务
[root@logstash ~]# yum install -y lrzsz [root@logstash ~]# rz rz waiting to receive.**[root@logstash ~]# ls 公共 模板 视频 图片 文档 下载 音乐 桌面 anaconda-ks.cfg initial-setup-ks.cfg logstash-7.1.1.rpm [root@logstash ~]# yum localinstall -y logstash-7.1.1.rpm ##命令优化 [root@logstash ~]# ln -s /usr/share/logstash/bin/logstash /usr/local/bin
192.168.58.163安装filebeat服务
[root@web1 ~]# yum install -y lrzsz [root@web1 ~]# rz rz waiting to receive.**[root@filebeat ~]# ls 公共 模板 视频 图片 文档 下载 音乐 桌面 anaconda-ks.cfg filebeat-7.1.1-x86_64.rpm initial-setup-ks.cfg [root@web1 ~]# yum localinstall -y filebeat-7.1.1-x86_64.rpm [root@web1 ~]# yum install -y nginx
5、修改配置文件
####192.168.58.160
[root@kibana ~]# vim /etc/kibana/kibana.yml
修改前
修改后

####192.168.58.161 [root@es ~]# vim /etc/elasticsearch/elasticsearch.yml
修改前

修改后


####192.168.58.162
#创建配置文件
[root@logstash ~]# cd /etc/logstash/
[root@logstash logstash]# ls
conf.d  jvm.options  log4j2.properties  logstash-sample.conf  logstash.yml  pipelines.yml  startup.options
[root@logstash logstash]# cd conf.d/
[root@logstash conf.d]# ls
[root@logstash conf.d]# vim pipline.conf
input {file {path => "/var/log/messages"start_position => "beginning"}beats {port => 5044}
}
filter {if [host][name] {mutate { add_field => { "hostname" => "%{[host][name]}" } }}else if [agent][hostname] {mutate { add_field => { "hostname" => "%{[agent][hostname]}" } }}else {mutate { add_field => { "hostname" => "%[host]" } }}
}
output {if [hostname] == "logstash" {elasticsearch {hosts => ["192.168.58.161:9200"]index => "system-log-%{+YYYY.MM.dd}"}}else if [hostname] == "web1" {if "system" in [tags] {elasticsearch {hosts => ["192.168.58.161:9200"]index => "web1-log-%{+YYYY.MM.dd}"}}if "nginx-access" in [tags] {elasticsearch {hosts => ["192.168.58.161:9200"]index => "web1-nginx-access-log-%{+YYYY.MM.dd}"}}if "nginx-error" in [tags] {elasticsearch {hosts => ["192.168.58.161:9200"]index => "web1-nginx-error-log-%{+YYYY.MM.dd}"}}}stdout {codec => rubydebug}
}
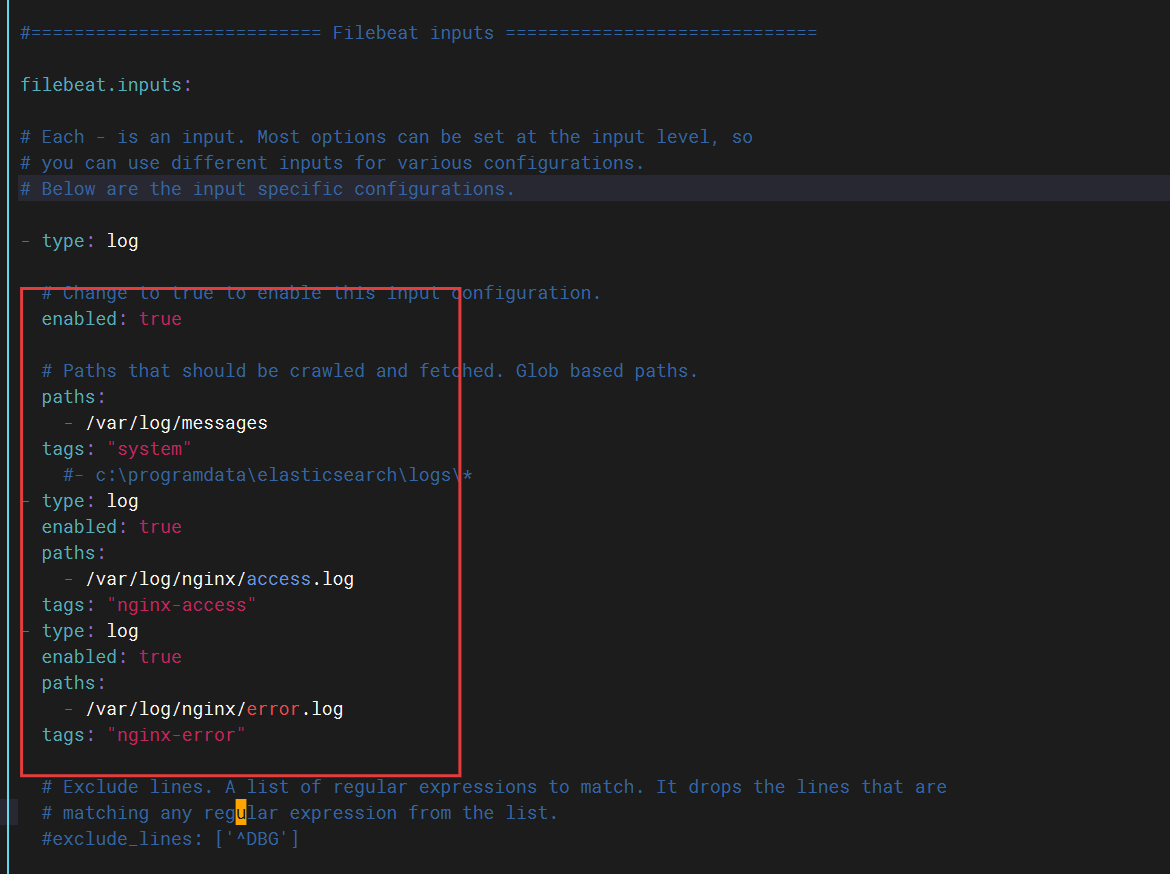
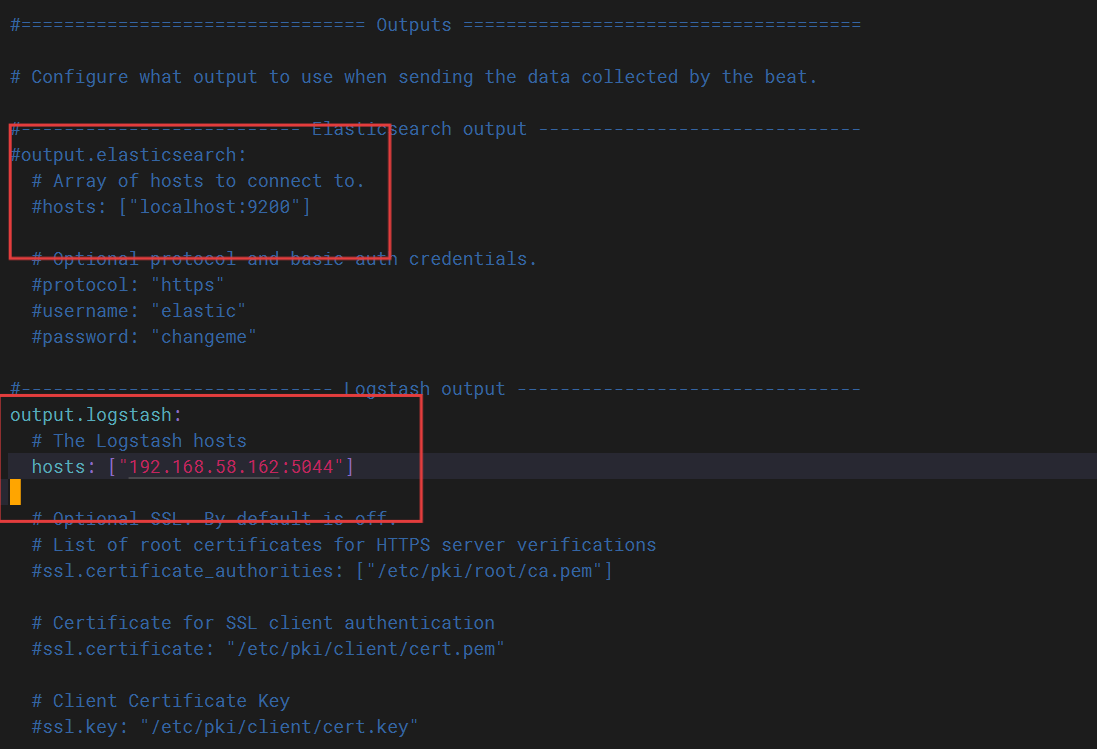
####192.168.58.163
[root@web1 ~]# cd /etc/filebeat/
[root@web1 filebeat]# ls
fields.yml  filebeat.reference.yml  filebeat.yml  modules.d
[root@web1 filebeat]# vim filebeat.yml
修改前


修改后
6、启动服务
####192.168.58.160
[root@kibana ~]# systemctl start kibana.service
####192.168.58.161
[root@es ~]# systemctl start elasticsearch.service
####192.168.58.163
[root@web1 filebeat]# systemctl start filebeat.service
[root@web1 filebeat]# systemctl start nginx.service
####192.168.58.162
[root@logstash ~]# logstash -e 'input { stdin{} } output { elasticsearch{ hosts=>["192.168.58.161:9200"]} }'
[root@logstash conf.d]# logstash -f /etc/logstash/conf.d/pipline.conf
##可以看到以下内容


7、网站访问
网站访问192.168.58.160:5601


