vue3 + echarts(5.6.0)实现渐变漏斗图
/*** 图表*/
type EChartsOption = echarts.EChartsOption;
let chartDom;
let trendAnalysisChart: echarts.ECharts;
// 监听窗口变化
const resizeHandler = () => trendAnalysisChart.resize();
window.addEventListener('resize', resizeHandler);
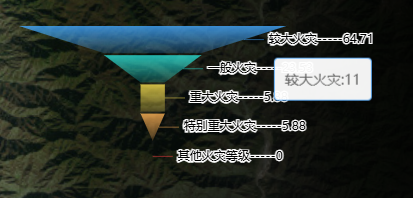
function getChart() {chartDom = document.getElementById('chartFEquipOtherDom')!;trendAnalysisChart = echarts.init(chartDom, 'dark');let option: {color: ({ x: number; y: number; y2: number; globalCoord: boolean; x2: number; colorStops: ({ offset: number; color: string } | { offset: number; color: string })[]; type: string } | { x: number; y: number; y2: number; globalCoord: boolean; x2: number; colorStops: ({ offset: number; color: string } | { offset: number; color: string })[]; type: string } | { x: number; y: number; y2: number; globalCoord: boolean; x2: number; colorStops: ({ offset: number; color: string } | { offset: number; color: string })[]; type: string } | { x: number; y: number; y2: number; globalCoord: boolean; x2: number; colorStops: ({ offset: number; color: string } | { offset: number; color: string })[]; type: string } | { x: number; y: number; y2: number; globalCoord: boolean; x2: number; colorStops: ({ offset: number; color: string } | { offset: number; color: string })[]; type: string })[]; series: { top: number; data: any[]; left: string; bottom: number; gap: number; width: string; itemStyle: { normal: { borderWidth: number; opacity: number } }; sort: string; label: { formatter: string; position: string }; labelLine: { normal: { show: boolean; position: string }; emphasis: { textStyle: { background: string; fontSize: number } } }; type: string }[]; tooltip: { formatter: string; trigger: string }};let colors = [{type: 'linear',x: 0,y: 0,x2: 0,y2: 1,colorStops: [{offset: 0, color: 'rgba(44,226,217,0.8)'}, {offset: 1, color: 'rgba(44,226,217,0.2)'}],globalCoord: false // 缺省为 false},{type: 'linear',x: 0,y: 0,x2: 0,y2: 1,colorStops: [{offset: 0, color: 'rgba(66,164,255,0.8)' // 0% 处的颜色}, {offset: 1, color: 'rgba(66,164,255,0.2)' // 0% 处的颜色}],globalCoord: false // 缺省为 false},{type: 'linear',x: 0,y: 0,x2: 0,y2: 1,colorStops: [{offset: 0, color: 'rgba(251,226,81,0.8)' // 0% 处的颜色}, {offset: 1, color: 'rgba(251,226,81,0.2)' // 0% 处的颜色}],globalCoord: false // 缺省为 false}, {type: 'linear',x: 0,y: 0,x2: 0,y2: 1,colorStops: [{offset: 0, color: 'rgba(255,178,85,0.8)' // 0% 处的颜色}, {offset: 1, color: 'rgba(255,178,85,0.2)' // 100% 处的颜色}],globalCoord: false // 缺省为 false}, {type: 'linear',x: 0,y: 0,x2: 0,y2: 1,colorStops: [{offset: 0, color: 'rgba(255,64,64,0.8)' // 0% 处的颜色}, {offset: 1, color: 'rgba(255,64,64,0.2)' // 100% 处的颜色}],globalCoord: false // 缺省为 false}];let lineargroup = [{"name": "一般火灾","value": 4},{"name": "较大火灾","value": 11},{"name": "重大火灾","value": 1},{"name": "特别重大火灾","value": 1},{"name": "其他火灾等级","value": 0}
];option = {color: colors,tooltip: {trigger: 'item',formatter: "{b}:{c}"},series: [{type: 'funnel',left: '0',top: 30,bottom: 30,width: '70%',sort: 'descending',gap: 2,label: {position: '',formatter: '{b}-----{d}'},labelLine: {normal: {show: true,position: ''},emphasis: {textStyle: {fontSize: 12,background: 'regb(0,0,0,0)'}}},itemStyle: {normal: {opacity: 1,borderWidth:0}},data: lineargroup},]};option && trendAnalysisChart.setOption(option);
}