vue中使用wavesurfer.js绘制波形图和频谱图
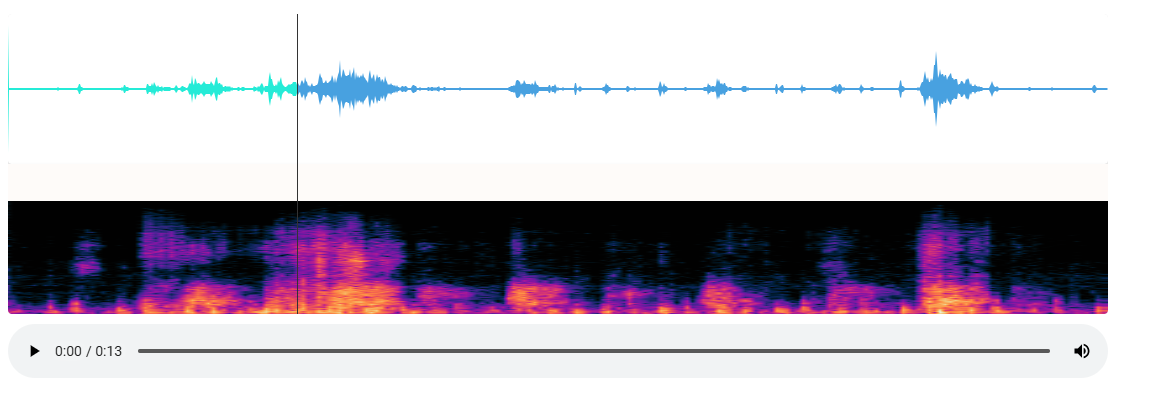
新的实现方式:vue使用Canvas绘制频谱图
安装wavesurfer.js
npm install wavesurfer.js
第一版:
组件特点:
- 一次性加载好所有的数据;
<template><div class="audio-visualizer-container"><div class="visualization-container"><div ref="waveform" class="waveform"></div><div ref="spectrogram" class="spectrogram"></div><div v-if="loading" class="loading-indicator">音频加载中...</div><div v-if="error" class="error-message">{{ error }}</div></div><div class="audio-controls"><audioref="audioPlayer"controls@play="startPlay"@pause="stopPlay"@seeked="handleSeek"controlsList="nodownload noplaybackrate"></audio></div></div>
</template><script>
import axios from 'axios'
import Vue from 'vue'
import { ACCESS_TOKEN } from '@/store/mutation-types'
import WaveSurfer from 'wavesurfer.js'
import Spectrogram from 'wavesurfer.js/dist/plugins/spectrogram.esm.js'
// https://juejin.cn/post/6979191645916889095export default {name: 'AudioWaveform',props: {audioUrl: {type: String,required: true,},},data() {return {wavesurfer: null,spectrogramPlugin: null,isPlaying: false,audioBlobUrl: null,loading: false,error: null,isUserInteraction: false, // 标记是否是用户交互}},watch: {audioUrl(newVal) {this.handleAudioUrl(newVal)},},mounted() {this.initWaveSurfer()this.handleAudioUrl(this.audioUrl)},beforeDestroy() {this.cleanup()},methods: {async initWaveSurfer() {try {this.wavesurfer = WaveSurfer.create({container: this.$refs.waveform,waveColor: '#48a1e0',progressColor: '#25ebd7',cursorColor: '#333',// cursorWidth: 1,// barWidth: 2,// barRadius: 3,height: 150,sampleRate: 8000, // 明确指定采样率// normalize: true,// backend: 'WebAudio',// renderFunction: (channels, ctx) => {//   console.log('Custom render function called!') // 确保执行//   // this.drawWaveform(ctx, channels[0]) // 使用第一个声道数据绘制波形//   const { width, height } = ctx.canvas//   const channelData = channels[0] // 使用左声道数据//   const dataLength = channelData.length//   const step = Math.max(1, Math.floor(dataLength / width)) // 确保步长≥1,避免除零//   ctx.beginPath()//   ctx.lineWidth = 1//   ctx.strokeStyle = '#48a1e0' // 波形颜色//   // 中心线位置(对称波形)//   const centerY = height / 2//   for (let i = 0; i < width; i++) {//     // 使用 step 控制数据采样间隔//     const dataIndex = Math.min(Math.floor(i * step), dataLength - 1) // 防止数组越界//     const value = channelData[dataIndex] // 获取振幅值(-1 到 1)//     // 映射振幅到 Canvas 高度//     const amplitude = value * centerY//     console.log(`绘制点: x=${i},value=${value} amplitude=${amplitude} realMv=${this.calcRealMv(value)}`) // 调试输出//     const x = i//     const y = centerY - amplitude // 向上为正,向下为负//     if (i === 0) {//       ctx.moveTo(x, y)//     } else {//       ctx.lineTo(x, y)//     }//   }//   ctx.stroke() // 绘制路径//   ctx.closePath()// },})// 初始化频谱图插件this.spectrogramPlugin = this.wavesurfer.registerPlugin(Spectrogram.create({container: this.$refs.spectrogram,// labels: true,// labelsBackground: 'rgba(0,0,0,0.1)', //频率标签的背景height: 150,fftSamples: 1024,