WebGIS 中常用公共插件
看过的知识不等于学会。唯有用心总结、系统记录,并通过温故知新反复实践,才能真正掌握一二
作为一名摸爬滚打三年的前端开发,开源社区给了我饭碗,我也将所学的知识体系回馈给大家,助你少走弯路!
OpenLayers、Leaflet 快速入门 ,每周保持更新 2 个案例
Cesium 快速入门,每周保持更新 4 个案例
地理空间分析插件
主要介绍 WebGIS 中常用的通用地理空间分析插件。像 Leaflet、Mapbox GL JS、OpenLayers 等地图库的定制化插件不在此处详述,更多插件介绍参考
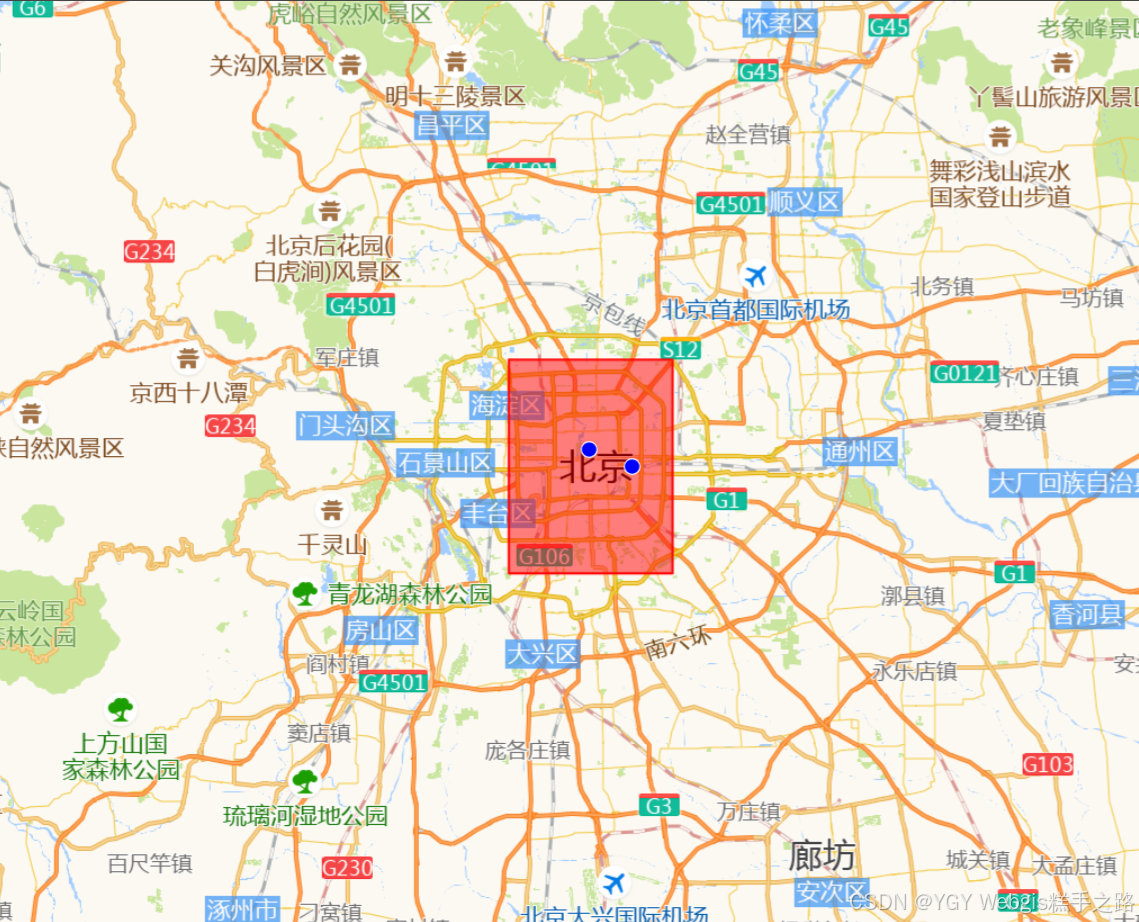
Turf.js
这个必须是第一位,Turf.js 在 WebGIS 插件中占据举足轻重的地位。大家可以当看 UI 库一样从头到尾过一遍,说不定能解决困惑许久的难题
-
功能:
- 提供 150+地理空间分析函数,包括缓冲区计算(
buffer)、距离测量(distance)、空间关系判断(booleanPointInPolygon)、叠加分析(intersect)等。 - 所有操作都基于 GeoJSON 格式
- 提供 150+地理空间分析函数,包括缓冲区计算(
-
中文网:https://turfjs.fenxianglu.cn/
-
安装与使用:
npm install @turf/turfimport * as turf from "@turf/turf"; // 创建一个点 const point = turf.point([116.397, 39.916]); // 计算点周围50公里的缓冲区 const buffered = turf.buffer(point, 50, { units: "kilometers" }); console.log("缓冲区GeoJSON:", buffered);// 判断一个点是否在多边形内 const polygon = turf.polygon([[[0, 0],[0, 10],[10, 10],[10, 0],[0, 0],], ]); const testPoint = turf.point([5, 5]); const isInPolygon = turf.booleanPointInPolygon(testPoint, polygon); console.log("点是否在多边形内:", isInPolygon);
proj4.js
-
功能:
- 坐标系转换(如 WGS84 转 Web 墨卡托
EPSG:4326 → EPSG:3857) - 支持自定义坐标系(通过
proj4.defs定义参数)
- 坐标系转换(如 WGS84 转 Web 墨卡托
-
文档:Proj4js 官方文档
-
安装与使用:
npm install proj4import proj4 from "proj4"; proj4.defs("EPSG:4490", "+proj=longlat +datum=CGCS2000"); // 定义CGCS2000坐标系 const point = [116.397516, 39.916639]; const converted = proj4("EPSG:4326", "EPSG:4490", point); // WGS84转CGCS2000
Terraformer-WKT-Parser
-
功能:
- WKT 与 GeoJSON 互转
-
文档:Terraformer-WKT-Parser GitHub
-
安装与使用:
npm install terraformer-wkt-parserimport WKT from "terraformer-wkt-parser"; // WKT → GeoJSON const wktPoint = "POINT(116.397 39.916)"; const geojsonPoint = WKT.parse(wktPoint); console.log("WKT 转 GeoJSON (点):", geojsonPoint);const wktPolygon = "POLYGON ((30 10, 40 40, 20 40, 10 20, 30 10))"; const geojsonPolygon = WKT.parse(wktPolygon); console.log("WKT 转 GeoJSON (多边形):", geojsonPolygon);// GeoJSON → WKT const geojsonLine = {type: "LineString",coordinates: [[-77, 38],[-76, 39],[-75, 38],], }; const wktLine = WKT.convert(geojsonLine); console.log("GeoJSON 转 WKT (线):", wktLine);
gcoord
gcoord 是一个专门为中国地理坐标系设计的坐标转换库,解决了国内常见的坐标系偏移问题。
-
功能:
- 支持 WGS84、GCJ02 (火星坐标系,高德/腾讯地图使用)、BD09 (百度坐标系) 之间的相互转换。
- 提供坐标纠偏功能,解决国内地图数据与实际地理位置的偏差。
- 支持点、线、多边形等 GeoJSON 几何类型的转换。
-
文档:gcoord GitHub
-
安装与使用:
npm install gcoord
import gcoord from "gcoord";// WGS84 坐标 (例如 GPS 设备获取的原始坐标)
const wgs84Point = [116.403963, 39.913709]; // 天安门广场 WGS84 坐标// WGS84 转 GCJ02 (高德/腾讯地图坐标)
const gcj02Point = gcoord.transform(wgs84Point, gcoord.WGS84, gcoord.GCJ02);
console.log("WGS84 转 GCJ02:", gcj02Point);// GCJ02 转 BD09 (百度地图坐标)
const bd09Point = gcoord.transform(gcj02Point, gcoord.GCJ02, gcoord.BD09);
console.log("GCJ02 转 BD09:", bd09Point);// BD09 转 WGS84 (用于数据存储或国际标准地图)
const backToWgs84 = gcoord.transform(bd09Point, gcoord.BD09, gcoord.WGS84);
console.log("BD09 转 WGS84:", backToWgs84);// 转换 GeoJSON 几何
const geojsonLine = {type: "LineString",coordinates: [[116.397, 39.916],[116.4, 39.92],[116.405, 39.918],],
};const transformedLine = gcoord.transform(geojsonLine,gcoord.WGS84,gcoord.GCJ02
);
console.log("GeoJSON LineString WGS84 转 GCJ02:", transformedLine);
geojson-vt
geojson-vt 是一个高性能的 JavaScript 库,用于将 GeoJSON 数据切片为矢量瓦片 (Vector Tiles),显著提高地图加载和渲染速度。
-
功能:
- 将大型 GeoJSON 数据集处理成适合地图瓦片系统使用的矢量瓦片。
- 支持动态切片,可以根据地图视口和缩放级别实时生成瓦片。
- 提供瓦片数据,可与 Leaflet、Mapbox GL JS 等地图库结合使用,实现高性能的矢量数据渲染。
-
特点/优势:
-
性能出色:特别适用于需要处理大量 GeoJSON 数据的项目,例如显示全国范围的地理数据、复杂的路网或行政区划。
-
动态加载:只加载和渲染当前视口所需的瓦片,减少内存占用和网络传输。
-
客户端处理:切片过程在客户端完成,减轻服务器压力。
-
灵活配置:支持设置瓦片大小、容差、最大缩放级别等参数。
-
文档:geojson-vt GitHub
-
安装与使用:
npm install geojson-vt
<template><div ref="mapContainer" id="map"></div>
</template><script setup>
import { ref, onMounted } from "vue";
import Map from "ol/Map.js";
import XYZ from "ol/source/XYZ.js";
import TileLayer from "ol/layer/Tile.js";
import View from "ol/View.js";
import { fromLonLat } from "ol/proj"; // 用于坐标转换
import VectorTileLayer from "ol/layer/VectorTile.js";
import VectorTileSource from "ol/source/VectorTile.js";
import Feature from "ol/Feature.js";
import { Point, LineString, Polygon } from "ol/geom"; // 导入几何类型
import { Fill, Stroke, Style, Circle } from "ol/style"; // 导入样式
import "ol/ol.css";
import geojsonvt from "geojson-vt";const mapContainer = ref(null);
let map = null;
let tileIndex = null; // 存储 geojson-vt 索引onMounted(() => {initMap();
});const initMap = () => {// 1. 准备 GeoJSON 数据const largeGeoJSON = {type: "FeatureCollection",features: [{type: "Feature",geometry: {type: "Point",coordinates: [116.397516, 39.916639], // 北京天安门附近},properties: {name: "Tiananmen Square",},},{type: "Feature",geometry: {type: "Polygon",coordinates: [[[116.3, 39.8],[116.5, 39.8],[116.5, 40.0],[116.3, 40.0],[116.3, 39.8],],],},properties: {name: "Beijing Area",},},{type: "Feature",geometry: {type: "LineString",coordinates: [[116.35, 39.95],[116.45, 39.95],],},properties: {name: "Beijing Road",},},{type: "Feature",geometry: {type: "Point",coordinates: [116.45, 39.9], // 另一个点},properties: {name: "Another Point",},},],};// 2. 创建 geojson-vt 瓦片索引tileIndex = geojsonvt(largeGeoJSON, {maxZoom: 18, // 确保覆盖 OpenLayers 的缩放范围minZoom: 0,tolerance: 3,extent: 4096, // 瓦片内部坐标范围});// 3. 定义矢量瓦片图层样式const vectorTileStyle = new Style({fill: new Fill({color: "rgba(255, 0, 0, 0.5)", // 红色半透明填充}),stroke: new Stroke({color: "red", // 红色边框width: 2,}),image: new Circle({radius: 7,fill: new Fill({color: "blue", // 蓝色点}),stroke: new Stroke({color: "white",width: 1,}),}),});// 4. 创建 VectorTileSourceconst vectorSource = new VectorTileSource({format: null, // 不需要内置格式解析器,因为我们手动处理url: "vector-tile://{z}/{x}/{y}", // 这是一个虚拟的URL,仅用于触发tileLoadFunctiontileLoadFunction: function (tile, url) {const [z, x, y] = url.replace("vector-tile://", "").split("/").map(Number);const data = tileIndex.getTile(z, x, y);const extent = 4096;const tile2lon = (x, z) => (x / Math.pow(2, z)) * 360 - 180;const tile2lat = (y, z) => {const n = Math.PI - (2 * Math.PI * y) / Math.pow(2, z);return (180 / Math.PI) * Math.atan(0.5 * (Math.exp(n) - Math.exp(-n)));};// 将瓦片像素坐标转为经纬度function pixelToLngLat(px, py, z, x, y) {const n = Math.pow(2, z);const tileX = x + px / extent;const tileY = y + py / extent;const lon = tile2lon(tileX, z);const lat = tile2lat(tileY, z);return [lon, lat];}const features = [];if (data && data.features) {data.features.forEach((feature) => {let geometry;switch (feature.type) {case 1: // Pointgeometry = new Point(pixelToLngLat(feature.geometry[0][0],feature.geometry[0][1],z,x,y));geometry = geometry.transform("EPSG:4326", "EPSG:3857");break;case 2: // LineStringgeometry = new LineString(feature.geometry.map((coord) =>pixelToLngLat(coord[0], coord[1], z, x, y)));geometry = geometry.transform("EPSG:4326", "EPSG:3857");break;case 3: // Polygongeometry = new Polygon([feature.geometry[0].map((coord) =>pixelToLngLat(coord[0], coord[1], z, x, y)),]);geometry = geometry.transform("EPSG:4326", "EPSG:3857");break;default:return;}const olFeature = new Feature({geometry: geometry,properties: feature.tags,});features.push(olFeature);});}tile.setFeatures(features);},});// 5. 创建 VectorTileLayerconst vectorLayer = new VectorTileLayer({source: vectorSource,style: vectorTileStyle, // 应用样式});// 6. 初始化地图map = new Map({target: mapContainer.value,controls: [], // 禁用默认控件layers: [new TileLayer({source: new XYZ({// 高德地图矢量图(含路网、含注记)// 注意:高德地图通常使用 EPSG:3857 投影url: "http://wprd0{1-4}.is.autonavi.com/appmaptile?x={x}&y={y}&z={z}&lang=zh_cn&size=1&scl=1&style=7 ",}),}),vectorLayer, // 添加矢量瓦片图层],view: new View({// 将中心点从 EPSG:4326 转换为 EPSG:3857center: fromLonLat([116.4074, 39.9042]), // 北京市中心经纬度zoom: 10,projection: "EPSG:3857", // 确保投影与高德地图瓦片一致}),});
};
</script><style scoped>
#map {position: absolute;top: 0;bottom: 0;width: 100%;
}
</style>
ts-shapefile
ts-shapefile 是一个用于在 TypeScript/JavaScript 环境中处理 ESRI Shapefile 格式的库。它主要用于读取 Shapefile 数据并将其转换为 GeoJSON 格式。(我也没有真正使用过该插件)
-
功能:
-
读取
.shp(几何数据) 和.dbf(属性数据) 文件。 -
将 Shapefile 数据解析为 GeoJSON FeatureCollection 格式。
-
支持多种 Shapefile 几何类型,如点、线、多边形。
-
特点/优势:
-
纯 JavaScript 实现,可在浏览器和 Node.js 环境中使用。
-
方便将传统的 Shapefile 数据集成到现代 WebGIS 应用中。
-
对于需要处理旧版或特定格式地理数据的项目非常有用。
-
文档:ts-shapefile GitHub
-
安装与使用:
npm install ts-shapefile
// 假设你有一个名为 'data.shp' 和 'data.dbf' 的 Shapefile 文件
// 在浏览器环境中,你可能需要通过文件输入或 fetch API 获取 ArrayBuffer
// 在 Node.js 环境中,你可以直接读取文件import { parseShp, parseDbf } from "ts-shapefile";
import fs from "fs"; // Node.js 环境async function loadShapefile() {try {// 示例:在 Node.js 环境中读取文件const shpBuffer = fs.readFileSync("path/to/your/data.shp");const dbfBuffer = fs.readFileSync("path/to/your/data.dbf");const geojsonFeatures = await parseShp(shpBuffer);const dbfRecords = await parseDbf(dbfBuffer);// 将几何和属性合并为完整的 GeoJSON FeatureCollectionconst featureCollection = {type: "FeatureCollection",features: geojsonFeatures.map((geom, index) => ({type: "Feature",geometry: geom,properties: dbfRecords[index] || {}, // 确保属性存在})),};console.log("Shapefile 转换为 GeoJSON:",JSON.stringify(featureCollection, null, 2));} catch (error) {console.error("读取 Shapefile 失败:", error);}
}// loadShapefile(); // 调用函数加载 Shapefile
注意:ts-shapefile 主要用于读取 Shapefile。如果需要将 GeoJSON 转换为 Shapefile,通常需要更复杂的服务器端处理或使用 GDAL/OGR 等工具。