131.在 Vue3 中使用 OpenLayers 测量长度和面积,并支持 modifyend 动态更新数值
🎯 效果预览(先睹为快)
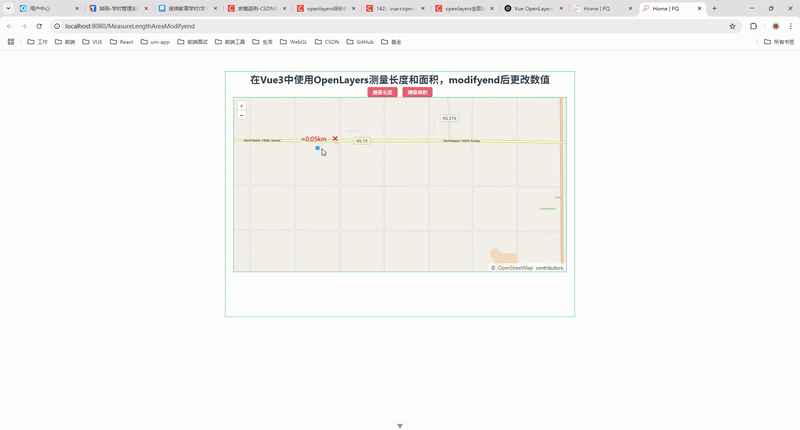
点击「测量长度」或「测量面积」按钮进行绘制,绘制结束后弹窗会显示长度或面积值。当你拖动修改节点后,弹窗中的数值也会实时更新。
🧭 前言
在 Web GIS 开发中,测量工具是非常常用的功能,比如长度、面积测量。OpenLayers 提供了 Draw 与 Modify 交互,可让我们实现用户自由绘制图形并修改它们。我们将通过 Vue3 + OpenLayers 实现:
-
支持用户测量长度(LineString)与面积(Polygon);
-
支持在图形修改后自动更新数值;
-
使用弹窗展示测量结果;
-
实现简洁、可控的交互逻辑。
📦 项目环境
如你尚未安装 OpenLayers,可使用:
npm install ol🧱 完整代码
<!--* @Author: 彭麒* @Date: 2025/5/28* @Email: 1062470959@qq.com* @Description: 此源码版权归吉檀迦俐所有,可供学习和借鉴或商用。-->
<template><div class="container"><div class="w-full flex justify-center flex-wrap"><div class="font-bold text-[24px]">在Vue3中使用OpenLayers测量长度和面积,modifyend后更改数值</div></div><h4><el-button type="danger" size="small" @click="measure('LineString')">测量长度</el-button><el-button type="danger" size="small" @click="measure('Polygon')">测量面积</el-button></h4><div id="vue-openlayers"></div><!-- 测量弹窗信息--><div id="measureBox" class="measure-popup" v-show="isMeasure"><div class="popup-closer" @click="clearMeasure"></div><div id="measureInfo"></div></div></div>
</template><script setup>
import { ref, onMounted } from 'vue'
import 'ol/ol.css'
import { Map, View } from 'ol'
import Tile from 'ol/layer/Tile'
import OSM from 'ol/source/OSM'
import VectorLayer from 'ol/layer/Vector'
import VectorSource from 'ol/source/Vector'
import Draw from 'ol/interaction/Draw'
import Modify from 'ol/interaction/Modify'
import Overlay from 'ol/Overlay'
import { LineString, Polygon } from 'ol/geom'
import { getArea, getLength } from 'ol/sphere'
import { unByKey } from 'ol/Observable'
import Style from 'ol/style/Style'
import Stroke from 'ol/style/Stroke'
import Fill from 'ol/style/Fill'
import CircleStyle from 'ol/style/Circle'// 响应式状态
const map = ref(null)
const isMeasure = ref(true)
const measure_draw = ref(null)
const modify = ref(null)
const measureSource = new VectorSource({ wrapX: false })
let measureOverlayer = nullfunction clearMeasure() {measureSource.clear()isMeasure.value = false
}function measure(type) {isMeasure.value = falsemeasureSource.clear()if (measure_draw.value) {map.value.removeInteraction(measure_draw.value)}const draw = new Draw({source: measureSource,type,})measure_draw.value = drawmap.value.addInteraction(draw)let listenerlet sketchdraw.on('drawstart', (evt) => {isMeasure.value = truesketch = evt.featurelistener = sketch.getGeometry().on('change', (e) => {showMeasureInfo(e.target)})})draw.on('drawend', () => {sketch = nullunByKey(listener)map.value.removeInteraction(draw)})startModify()
}function startModify() {const modifyInteraction = new Modify({ source: measureSource })modify.value = modifyInteractionmap.value.addInteraction(modifyInteraction)modifyInteraction.on('modifyend', (e) => {const feature = e.features.getArray()[0]const geom = feature.getGeometry()showMeasureInfo(geom)})
}function showMeasureInfo(geom) {const measureBox = document.getElementById('measureBox')const measureInfo = document.getElementById('measureInfo')if (!measureOverlayer) {measureOverlayer = new Overlay({name: 'overlayLayer',element: measureBox,autoPan: true,autoPanAnimation: {duration: 250,},})map.value.addOverlay(measureOverlayer)}let output = ''let coordif (geom instanceof Polygon) {const area = getArea(geom)output = '≈' + (Math.round((area / 1000000) * 100) / 100) + 'km<sup>2</sup>'coord = geom.getInteriorPoint().getCoordinates()}if (geom instanceof LineString) {const length = getLength(geom)output = '≈' + (Math.round((length / 1000) * 100) / 100) + 'km'coord = geom.getLastCoordinate()}measureInfo.innerHTML = outputmeasureOverlayer.setPosition(coord)
}function initMap() {const raster = new Tile({ source: new OSM() })const measureLayer = new VectorLayer({source: measureSource,style: new Style({fill: new Fill({ color: [0, 0, 0, 0.000005] }),stroke: new Stroke({ color: '#f00', width: 2 }),image: new CircleStyle({radius: 5,fill: new Fill({ color: '#ff0000' }),}),}),})map.value = new Map({target: 'vue-openlayers',layers: [raster, measureLayer],view: new View({center: [-11000000, 4600000],zoom: 13,}),})
}onMounted(() => {initMap()
})
</script><style scoped>
.container {width: 840px;height: 590px;margin: 50px auto;border: 1px solid #42B983;
}#vue-openlayers {width: 800px;height: 420px;margin: 0 auto;border: 1px solid #42B983;position: relative;
}.measure-popup {position: absolute;background-color: transparent;color: #f00;padding: 5px 35px 5px 10px;bottom: 5px;left: -50px;font-size: 16px;border-radius: 4px;
}.popup-closer {text-decoration: none;position: absolute;top: 4px;right: 8px;cursor: pointer;
}.popup-closer:after {content: "✖";
}
</style>
📌 技术要点总结
-
使用
Draw交互进行绘制,结合getLength与getArea实现测量; -
使用
Overlay创建测量提示框; -
监听
Modify的modifyend事件,动态更新信息; -
使用
unByKey销毁绘制时绑定的事件,防止内存泄漏; -
使用 Vue3
ref与onMounted实现响应式地图组件。
📚 参考资料
-
OpenLayers 官方文档
-
OpenLayers 测量示例
-
Vue3 官方文档
📝 最后
该功能是 GIS 系统中非常典型的交互组件,既可用于 Web 地图应用、三维测绘系统,也适合教学或私有项目使用。你可以将其封装为组件,以便更广泛复用。
欢迎点赞、评论、收藏,有问题欢迎一起探讨!🚀