使用 nginx-module-vts 进行 Nginx 流量监控
前言
1. 安装 nginx-module-vts
1.1 下载并解压模块
1.2 重新编译 Nginx,添加 nginx-module-vts 模块
假设:
2. 配置 Nginx 以启用 nginx-module-vts
2.1 配置工作进程和连接
2.2 启用 nginx-module-vts 模块
2.3 配置日志格式
2.4 启用 Gzip 压缩
2.5 配置流量监控页面
3. 重启 Nginx 使配置生效
4. 访问流量监控页面
5. 自定义配置和高级选项
5.1 自定义流量监控格式
5.2 配置多个虚拟主机的流量监控
6. 常见问题
6.1 无法访问流量监控页面
6.2 流量数据未显示
前言
nginx-module-vts(Nginx Vhost Traffic Status)是一个功能强大的 Nginx 模块,可以帮助我们实时监控 Nginx 的流量信息。通过这个模块,你可以查看每个虚拟主机(Vhost)的流量数据,包括请求数、响应时间、流量等统计信息。本文将详细介绍如何安装、配置和使用 nginx-module-vts 来监控 Nginx 流量。
1. 安装 nginx-module-vts
1.1 下载并解压模块
nginx-module-vts 是一个第三方模块,必须手动下载并编译到 Nginx 中。你可以通过 Git 克隆源代码,或者下载 ZIP 包。以下是通过 Git 克隆模块的步骤:
cd /opt
git clone https://github.com/vozlt/nginx-module-vts.git
如果你没有安装 Git,可以直接从 GitHub 仓库 下载 ZIP 包并解压。
1.2 重新编译 Nginx,添加 nginx-module-vts 模块
为了将 nginx-module-vts 集成到 Nginx 中,你需要重新编译 Nginx,并在配置时通过 --add-module 参数添加 nginx-module-vts 模块。
假设:
-
Nginx 源码路径:
/usr/local/src/nginx-1.24.0 -
nginx-module-vts模块路径:/opt/nginx-module-vts
执行以下命令来重新编译 Nginx:
cd /usr/local/src/nginx-1.24.0
# 配置 Nginx,并添加 vts 模块
./configure --prefix=/usr/local/nginx \
--add-module=/opt/nginx-module-vts
# 编译并安装 Nginx
make && make install
确保在重新编译时使用了与之前相同的配置参数。如果你不确定原始的配置参数,可以运行 nginx -V 来查看。
2. 配置 Nginx 以启用 nginx-module-vts
2.1 配置工作进程和连接
首先,你可以根据你的服务器硬件调整工作进程和连接数。以下是你的配置示例:
worker_processes 4;
events {
use epoll;
worker_connections 4096;
}
这表示 Nginx 使用 4 个工作进程,每个进程最多能够处理 4096 个连接。
2.2 启用 nginx-module-vts 模块
在 http 块内,你需要添加 vhost_traffic_status_zone 指令来配置流量监控。此指令为流量统计分配内存空间:
http {
vhost_traffic_status_zone; # 启用流量状态跟踪
}
2.3 配置日志格式
为了便于流量分析和后续处理,你自定义了日志格式,采用 JSON 格式记录每个请求的详细信息。这对后期的数据分析和流量监控非常有帮助:
log_format main '{ "@timestamp": "$time_local", ''"@fields": { ''"uri":"$request_uri",''"url":"$uri",''"upstream_addr":"$upstream_addr",''"remote_addr": "$remote_addr", ''"remote_user": "$remote_user", ''"body_bytes_sent": "$body_bytes_sent", ''"host":"$host",''"server_addr":"$server_addr",''"request_time": "$request_time", ''"status":"$status",''"request": "$request", ''"request_method": "$request_method", ''"size":$body_bytes_sent,''"upstream_time":"$upstream_response_time",''"http_referrer": "$http_referer", ''"http_x_forwarded_for": "$http_x_forwarded_for", ''"http_user_agent": "$http_user_agent" } }';
这个配置将请求的详细信息(如请求的 URI、响应时间、客户端 IP 地址等)记录到 Nginx 的访问日志中。
2.4 启用 Gzip 压缩
为了提高传输效率,配置了 Gzip 压缩选项,这样可以减少数据传输量:
gzip on;
gzip_min_length 1k;
gzip_buffers 4 16k;
gzip_comp_level 3;
gzip_types text/plain text/css application/x-javascript text/xml application/xml application/xml+rss text/javascript application/json application/javascript;
gzip_vary on;
这些配置确保 Nginx 对符合条件的文件进行压缩,从而减少传输的数据量,提高页面加载速度。
2.5 配置流量监控页面
为了查看流量统计数据,创建了一个 /status 页面,用于显示 nginx-module-vts 模块的监控信息:
server {
listen 8080;
server_name localhost;
location /status {
vhost_traffic_status_display;
vhost_traffic_status_display_format html; # 格式化显示流量数据为 HTML }
}
这段配置将在 localhost 上启动一个监控页面,访问 http://localhost:8080/status 可以查看实时的流量数据。
3. 重启 Nginx 使配置生效
配置修改完成后,你需要重启 Nginx 使配置生效:
# 检查配置是否正确 /usr/local/nginx/sbin/nginx -t
# 重新加载 Nginx 配置 /usr/local/nginx/sbin/nginx -s reload
4. 访问流量监控页面
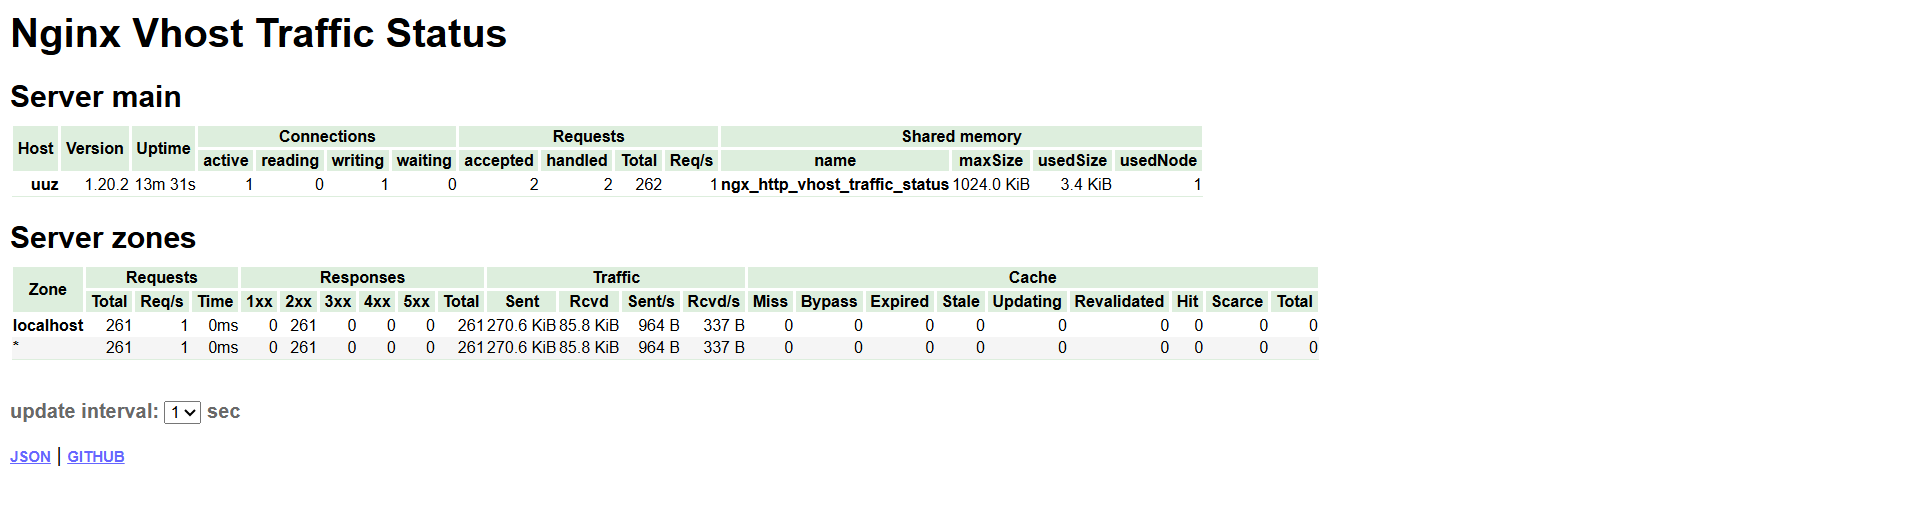
访问 http://localhost:8080/status 后,你将看到实时的流量监控信息。页面会显示每个虚拟主机的流量状态,包括请求数、响应时间、流量大小等。
5. 自定义配置和高级选项
5.1 自定义流量监控格式
你可以通过 vhost_traffic_status_display_format 来修改监控数据的显示格式。如果你需要 JSON 格式的流量数据,使用以下配置:
location /status {
vhost_traffic_status_display;
vhost_traffic_status_display_format json;
}
JSON 格式适合机器读取,便于后续的数据处理和集成。
5.2 配置多个虚拟主机的流量监控
你可以添加多个 server 块来配置不同的虚拟主机。每个虚拟主机会独立显示其流量数据。例如:
server {
listen 8081;
server_name example.com;
location / {
root /var/www/example;
index index.html; }
}这样,example.com 的流量会显示在 /status 页面中,便于对不同网站流量的独立监控。
6. 常见问题
6.1 无法访问流量监控页面
如果无法访问监控页面,首先检查防火墙设置,确保端口 8080 没有被阻塞。你可以使用以下命令检查 Nginx 是否在监听该端口:
netstat -tuln | grep 80806.2 流量数据未显示
如果流量数据没有显示,首先检查 Nginx 配置文件中的 vhost_traffic_status_zone 和 vhost_traffic_status_display 指令是否正确。如果没有数据,可以尝试重新加载 Nginx 配置或查看 Nginx 的错误日志。
7. 完整配置
# 设置工作进程数和连接数
worker_processes  4;events {use epoll;worker_connections  4096;
}http {# 加载 MIME 类型include       mime.types;default_type  application/octet-stream;# 启用 vts 模块并设置流量监控区vhost_traffic_status_zone;    # 启用流量状态跟踪# 配置日志格式log_format main '{ "@timestamp": "$time_local", ''"@fields": { ''"uri":"$request_uri",''"url":"$uri",''"upstream_addr":"$upstream_addr",''"remote_addr": "$remote_addr", ''"remote_user": "$remote_user", ''"body_bytes_sent": "$body_bytes_sent", ''"host":"$host",''"server_addr":"$server_addr",''"request_time": "$request_time", ''"status":"$status",''"request": "$request", ''"request_method": "$request_method", ''"size":$body_bytes_sent,''"upstream_time":"$upstream_response_time",''"http_referrer": "$http_referer", ''"http_x_forwarded_for": "$http_x_forwarded_for", ''"http_user_agent": "$http_user_agent" } }';# 启用 Gzip 压缩gzip  on;gzip_min_length   1k;gzip_buffers      4 16k;gzip_comp_level   3;gzip_types        text/plain text/css application/x-javascript text/xml application/xml application/xml+rss text/javascript application/json application/javascript;gzip_vary         on;# 代理设置proxy_http_version 1.1;proxy_set_header Connection "";# 配置虚拟主机流量监控server {listen       8080;server_name  localhost;# 默认页面配置location / {root   html;index  index.html index.htm;}# 错误页面配置error_page   500 502 503 504  /50x.html;location = /50x.html {root   html;}# 流量监控页面location /status {vhost_traffic_status_display;                  # 显示流量数据vhost_traffic_status_display_format html;       # 格式化显示为 HTML}# 其他配置(如 PHP 代理等)可以根据需要启用# location ~ \.php$ {#     fastcgi_pass 127.0.0.1:9000;#     fastcgi_param SCRIPT_FILENAME /var/www/html$fastcgi_script_name;#     include fastcgi_params;# }}# 其他虚拟主机配置示例server {listen       8081;server_name  example.com;location / {root   /var/www/example;index  index.html;}}
}