记一次 .NET 某光谱检测软件 内存暴涨分析
一:背景
1. 讲故事
训练营里的一位学员找到我,说他们的系统会出现内存暴涨的情况,看了下也不是托管堆的问题,让我协助一下到底怎么回事?既然有dump了,那就开始分析之旅吧。
二:内存暴涨分析
1. 为什么会暴涨
在分析之前还是那条原则,不要过分的相信求助者的话,否则容易被他带沟里去,毕竟人家是业余的,你是专业的。。。接下来使用 !address -summary 观察下提交内存,输出如下。
0:000> !address -summary--- Usage Summary ---------------- RgnCount ----------- Total Size -------- %ofBusy %ofTotal
Free                                    637     5ffd`2b0ce000 (  95.989 TB)           74.99%
<unknown>                              2783     2001`3b63cc00 (  32.005 TB)  99.98%   25.00%
Heap                                   3737        1`509cf000 (   5.260 GB)   0.02%    0.00%
Image                                  2615        0`2deb1400 ( 734.692 MB)   0.00%    0.00%
Stack                                   235        0`12d00000 ( 301.000 MB)   0.00%    0.00%
Other                                    80        0`082c8000 ( 130.781 MB)   0.00%    0.00%
TEB                                      78        0`0009c000 ( 624.000 kB)   0.00%    0.00%
PEB                                       1        0`00001000 (   4.000 kB)   0.00%    0.00%--- Type Summary (for busy) ------ RgnCount ----------- Total Size -------- %ofBusy %ofTotal
MEM_PRIVATE                            6681     2002`9d342000 (  32.010 TB) 100.00%   25.01%
MEM_IMAGE                              2625        0`2deca000 ( 734.789 MB)   0.00%    0.00%
MEM_MAPPED                              223        0`09d16000 ( 157.086 MB)   0.00%    0.00%--- State Summary ---------------- RgnCount ----------- Total Size -------- %ofBusy %ofTotal
MEM_FREE                                637     5ffd`2b0ce000 (  95.989 TB)           74.99%
MEM_RESERVE                             855     2001`4093a000 (  32.005 TB)  99.98%   25.00%
MEM_COMMIT                             8674        1`945e8000 (   6.318 GB)   0.02%    0.00%
...
从卦中可以看到当前 MEM_COMMIT=6.3G 和 Heap=5.2G,卦象里已经非常明显的表明当前属 NT堆 暴涨,缩小范围之后继续使用 !heap -s 下钻分析。
0:000> !heap -s************************************************************************************************************************NT HEAP STATS BELOW
************************************************************************************************************************
NtGlobalFlag enables following debugging aids for new heaps:stack back traces
LFH Key                   : 0x7a5897d060b6c4ee
Termination on corruption : ENABLEDHeap     Flags   Reserv  Commit  Virt   Free  List   UCR  Virt  Lock  Fast (k)     (k)    (k)     (k) length      blocks cont. heap
-------------------------------------------------------------------------------------
0000016214c40000 08000002 4711276 4710972 4710884   9187  1416   295   19     6d   LFH
000001620cbd0000 08008000      64      8     64      6     1     1    0      0
0000016214f60000 08001002    1472    132   1080     21     7     2    0      0   LFH
...
从卦象看,这高内存是由 Heap=0000016214c40000 贡献的,其中 Commit=4.71G 也明确的表明当前是由海量的 alloc <1M 的 block 引发的,由于这个dump已经开启了 stack back traces,所以能够轻松的拿到分配block的调用栈。
2. 海量的block是什么
要想找到这个答案,可以对heap进行分配排序来观察异常特征,使用 !heap -stat -h 0000016214c40000 命令。
0:000> !heap -stat -h 0000016214c40000heap @ 0000016214c40000
group-by: TOTSIZE max-display: 20size     #blocks     total     ( %) (percent of total busy bytes)4000 40e08 - 103820000  (88.20)1000 15a1d - 15a1d000  (7.35)1309800 5 - 5f2f800  (2.02)e6a900 2 - 1cd5200  (0.61)ba6a20 1 - ba6a20  (0.25)3a8000 3 - af8000  (0.23)4ce500 2 - 99ca00  (0.20)800027 1 - 800027  (0.17)...
从卦中可以看到 block=4000byte 的块有 0x40e08 个,总大小为 0x103820000 = 4.3G,看样子离真相越来越近了,接下来使用 !heap -flt s 4000 看下这 0x40e08 个block都是些什么东西,部分输出如下:
0:000> !heap -flt s 4000_HEAP @ 16214c40000HEAP_ENTRY Size Prev Flags UserPtr UserSize - state000001622fa684a0 0403 0000 [00] 000001622fa684d0 04000 - (busy)...0000016281dcf7b0 0403 0403 [00] 0000016281dcf7e0 04000 - (busy)0000016281dd37e0 0403 0403 [00] 0000016281dd3810 04000 - (busy)0000016281dd7810 0403 0403 [00] 0000016281dd7840 04000 - (busy)0000016281ddb840 0403 0403 [00] 0000016281ddb870 04000 - (busy)0000016281ddf870 0403 0403 [00] 0000016281ddf8a0 04000 - (busy)0000016281de38a0 0403 0403 [00] 0000016281de38d0 04000 - (busy)0000016281de78d0 0403 0403 [00] 0000016281de7900 04000 - (busy)0000016281deb900 0403 0403 [00] 0000016281deb930 04000 - (busy)0000016281def930 0403 0403 [00] 0000016281def960 04000 - (busy)0000016281df3960 0403 0403 [00] 0000016281df3990 04000 - (busy)0000016281df7990 0403 0403 [00] 0000016281df79c0 04000 - (busy)...
接下来就是使用 !heap -p -a 0000016281df7990 抽几个 block 观察其分配栈,全都是如下输出:
0:000> !heap -p -a 0000016281df7990address 0000016281df7990 found in_HEAP @ 16214c40000HEAP_ENTRY Size Prev Flags UserPtr UserSize - state0000016281df7990 0403 0000 [00] 0000016281df79c0 04000 - (busy)7ffa3dadb49d ntdll!RtlpAllocateHeapInternal+0x0000000000000a7d7ffa3b44fde6 ucrtbase!_malloc_base+0x00000000000000367ff9faacc1a9 xxxWrapper!xxxWrapper::operator=+0x00000000000088197ff9faac5474 xxxWrapper!xxxWrapper::operator=+0x0000000000001ae47ff9faac3efb xxxWrapper!xxxWrapper::operator=+0x000000000000056b7ff9c8c06606 +0x00007ff9c8c06606从卦象看是 0x00007ff9c8c06606 调用了 xxxWrapper.dll,可能有些人有疑问,前者为什么是地址而不是函数名,这是因为它是JIT动态生成的哈,使用 !ip2md 0x00007ff9c8c06606 让其现出原形。
0:000> !ip2md 0x00007ff9c8c06606
MethodDesc:   00007ff9c8e00068
Method Name:  xxxWrapper.xxxWrapperHelper.GetSpectrum(Int32)
Class:        00007ff9c8ded028
MethodTable:  00007ff9c8e001f8
mdToken:      0000000006000073
Module:       00007ff9c8dbcce8
IsJitted:     yes
CodeAddr:     00007ff9c8c06590
Transparency: Safe critical
最后根据 GetSpectrum 找到相应的源码,截图如下:
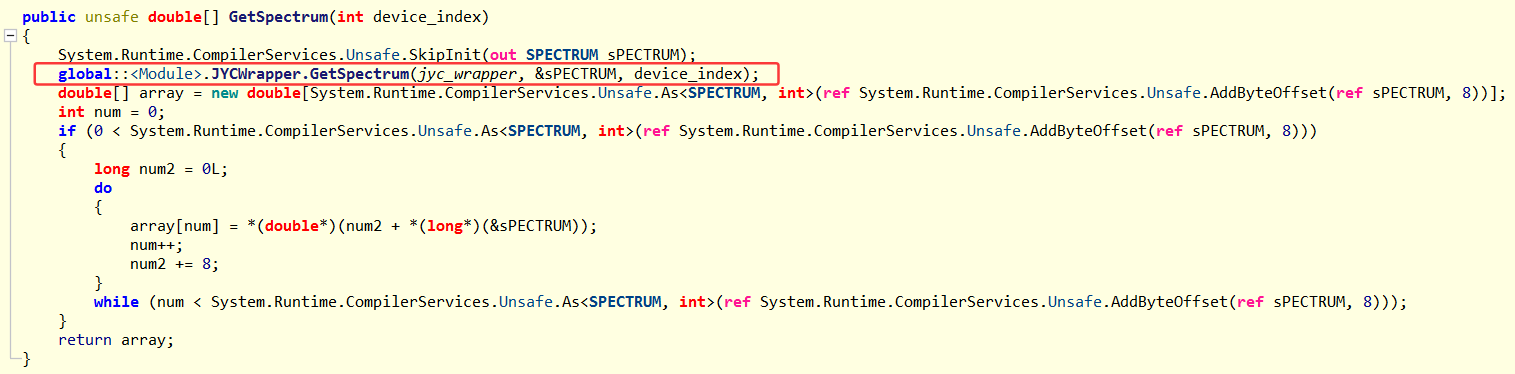
从卦中看应该只有分配,没有调用相关的释放 函数导致的,让朋友找一下 GetSpectrum 函数的 C++ 方,定会提供相关指导意见。
三:总结
本次内存暴涨事故属于C++和C#团队没有很好的沟通和协作引发的,不过像这种多语言项目想不弄出点事都难哈。