echarts图封装 自动切换 大屏 swiper 切换里面放echarts图,注意不要开循环 否则出不来
swiper 切换里面放echarts图,注意不要开循环 否则出不来
最下面是echarts图 字体大小适应设置
方法一:
子组件
<template><div class="chart-container" ref="chartRef" :style="{ width, height }"></div>
</template><script>
export default {name: "BaseChart",props: {time: { type: Number, default: 2000 },width: { type: String, default: "100%" },height: { type: String, default: "400px" },options: { type: Object, required: true },automatic: { type: String, default: "自动" }, // 控制是否自动播放},data() {return {chart: null,currentIndex: 0,animationTimer: null,animationInitialized: false,};},watch: {options: {deep: true,handler(newVal) {this.updateChart(newVal);},},},mounted() {this.initChart();window.addEventListener("resize", this.resizeChart);},beforeDestroy() {this.disposeChart();this.stopAnimation();window.removeEventListener("resize", this.resizeChart);},methods: {initChart() {this.chart = this.$echarts.init(this.$refs.chartRef);this.chart.setOption(this.options);this.$nextTick(() => {if (this.automatic === "自动") {setTimeout(() => this.setupChartAnimation(), 500); // 延迟确保图表已渲染}});},setupChartAnimation() {const data = this.options?.series?.[0]?.data;if (!this.chart || !data?.length) return;this.currentIndex = 0;this.startAnimation();if (!this.animationInitialized) {this.bindChartEvents();this.animationInitialized = true;}},startAnimation() {this.stopAnimation();const dataLen = this.options.series[0].data.length;if (!dataLen) return;this.highlightDataPoint(this.currentIndex);this.animationTimer = setInterval(() => {this.downplayDataPoint(this.currentIndex);this.currentIndex = (this.currentIndex + 1) % dataLen;this.highlightDataPoint(this.currentIndex);}, this.time);},highlightDataPoint(index) {this.chart.dispatchAction({type: "highlight",seriesIndex: 0,dataIndex: index,});this.chart.dispatchAction({type: "showTip",seriesIndex: 0,dataIndex: index,});},downplayDataPoint(index) {this.chart.dispatchAction({type: "downplay",seriesIndex: 0,dataIndex: index,});this.chart.dispatchAction({type: "hideTip",seriesIndex: 0,dataIndex: index,});},stopAnimation() {if (this.animationTimer) {clearInterval(this.animationTimer);this.animationTimer = null;}},bindChartEvents() {this.chart.on("mouseover", (e) => {this.stopAnimation();this.chart.dispatchAction({ type: "downplay", seriesIndex: 0 });this.chart.dispatchAction({type: "highlight",seriesIndex: 0,dataIndex: e.dataIndex,});});this.chart.on("mouseout", (e) => {this.currentIndex = e.dataIndex;this.startAnimation();});},updateChart(newOptions) {if (!this.chart) return;this.chart.setOption(newOptions, true);if (this.automatic === "自动") {this.setupChartAnimation();}},resizeChart() {this.chart?.resize();},disposeChart() {if (this.chart) {this.chart.dispose();this.chart = null;}},},
};
</script><style scoped>
.chart-container {display: block;
}
</style>
父组件:
<base-chartwidth="100%"height="3.2rem":options="projectBarOptions"
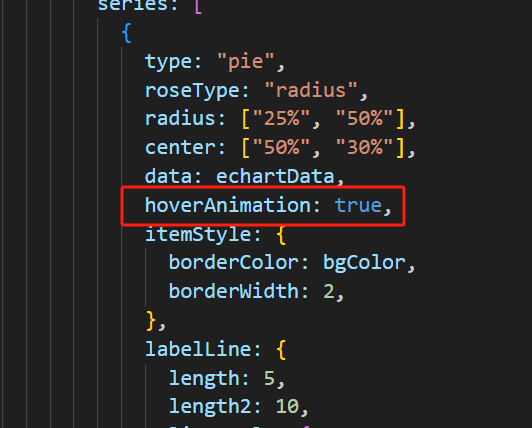
></base-chart>import BaseChart from "@/components/BaseChart.vue";export default {components: {swiper,swiperSlide,BaseChart,},//科研成果 项目 饼图getProjectBar() {let bgColor = "#001037";let color = ["#3168B5","#2E52AF","#2598B0","#288C4B","#0270f2","#488cf7",];let echartData = [{name: "福建省社科研究基地重大项目",value: "45",},{name: "福建省社科基金项目",value: "18",},{name: "省民宗厅项目",value: "15",},{name: "横向项目",value: "22",},];let total = 0;echartData.forEach((item) => {total += item.value * 1;});// let formatNumber = function (num) {// let reg = /(?=(\B)(\d{3})+$)/g;// return num.toString().replace(reg, ",");// };let option = {// backgroundColor: bgColor,color: color,legend: {show: true,orient: "vertical",top: "bottom",left: "15%",icon: "rect",itemWidth: 15,itemHeight: 15,textStyle: {color: "#7E95B7",fontSize: fontChart(18),lineHeight: 10,},data: echartData,// formatter: (name) => {// if (echartData.length) {// const item = pieData.filter((item) => item.name === name)[0];// return ` ${name} ${item.value}`;// }// },},series: [{type: "pie",roseType: "radius",radius: ["25%", "50%"],center: ["50%", "30%"],data: echartData,hoverAnimation: true,itemStyle: {borderColor: bgColor,borderWidth: 2,},labelLine: {length: 5,length2: 10,lineStyle: {// color: '#e6e6e6'},},label: {formatter: (params) => {// console.log(params, "888888888888888");// 将颜色存储在闭包中// this._labelColor = params.color;let num = (params.data.value / total) * 100 + "%";return "{name|" + num + "}";},rich: {name: {fontSize: fontChart(22),fontFamily: "SimSun",padding: [0, 0, 0, 2],color: "#3168B5",},value: {fontSize: fontChart(36),fontFamily: "SimSun",fontWeight: "bolder",padding: [0, 0, 0, 2],},icon: {fontSize: fontChart(22),fontFamily: "SimSun",// color: () => this._labelColor,},},},},],};this.projectBarOptions = option;},注意: 这个一定要设置为true ,不然切换高亮时 图形不变化
方法二:
父组件:
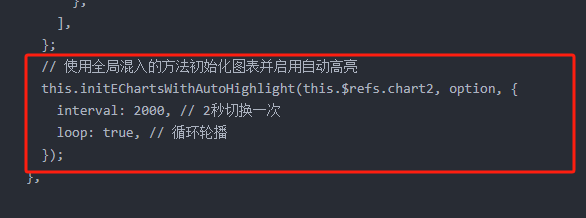
<div class="box1-echarts" ref="chart2" style="height: 90%"></div>mounted() {this.initChart2();},initChart2() {var colorList = [{type: "linear",x: 0,y: 0,x2: 1,y2: 1,colorStops: [{offset: 0,color: "rgba(1, 140, 248, 0.11)", // 0% 处的颜色},{offset: 1,color: "rgba(1, 140, 248, 0.78)", // 100% 处的颜色},],globalCoord: false, // 缺省为 false},{type: "linear",x: 1,y: 0,x2: 0,y2: 1,colorStops: [{offset: 0,color: "rgba(22, 79, 226, 0.01)", // 0% 处的颜色},{offset: 1,color: "rgba(22, 79, 226, 0.78)", // 100% 处的颜色},],globalCoord: false, // 缺省为 false},{type: "linear",x: 1,y: 0,x2: 0,y2: 0,colorStops: [{offset: 0,color: "rgba(37, 152, 176, 0.01)", // 0% 处的颜色},{offset: 1,color: "rgba(37, 152, 176, 0.78)", // 100% 处的颜色},],globalCoord: false, // 缺省为 false},{type: "linear",x: 0,y: 1,x2: 0,y2: 0,colorStops: [{offset: 0,color: "rgba(40, 140, 75, 0.01)", // 0% 处的颜色},{offset: 1,color: "rgba(40, 140, 75, 0.78)", // 100% 处的颜色},],globalCoord: false, // 缺省为 false},];var colorLine = ["#018CF8", "#164FE2", "#289FB9", "#44A45C"];let data = [{name: "台北市",value: 25,},{name: "新北市",value: 20,},{name: "桃园市",value: 18,},{name: "台中市",value: 15,},].sort((a, b) => {return b.value - a.value;});data.forEach((v, i) => {v.labelLine = {lineStyle: {width: 1,color: colorLine[i],},};});let option = {series: [{type: "pie",radius: ["40%", "75%"],center: ["50%", "45%"],clockwise: true,avoidLabelOverlap: true,label: {show: true,position: "outside",formatter: function (params) {const name = params.name;// const percent = params.percent + '%'const index = params.dataIndex;return [`{a${index}|${name}}`];// return [`{a${index}|${name}:${percent}}`, `{hr${index}|}`].join('\n')},// rich: getRich(),},itemStyle: {normal: {color: function (params) {return colorList[params.dataIndex];},},},data,roseType: "radius",},],};// 使用全局混入的方法初始化图表并启用自动高亮this.initEChartsWithAutoHighlight(this.$refs.chart2, option, {interval: 2000, // 2秒切换一次loop: true, // 循环轮播});},高亮设置:
全局引入initEChartsWithAutoHighlight 方法
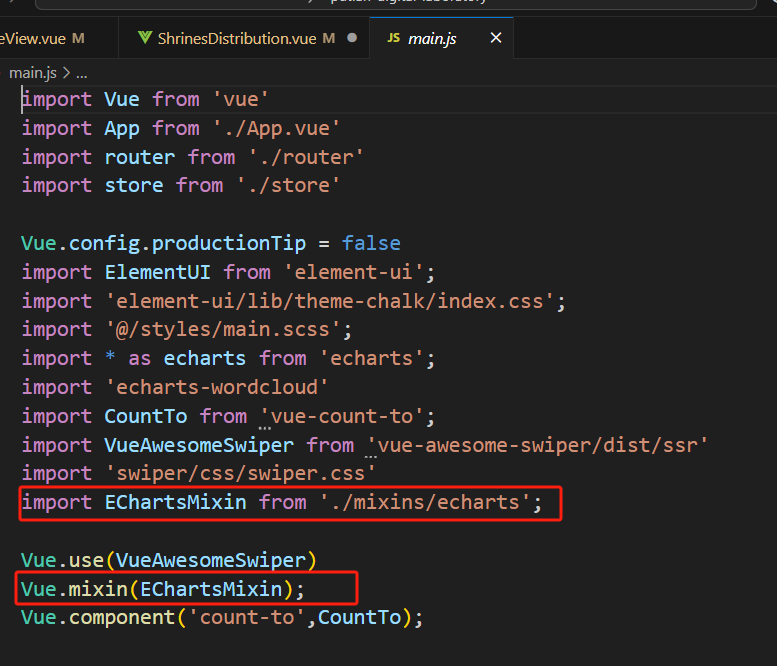
echarts.js 文件:
import { createAutoHighlight } from '@/utils/echarts';export default {data() {return {chartInstances: [], // 存储图表实例autoHighlightInstances: [] // 存储自动高亮实例};},methods: {/*** 初始化ECharts并启用自动高亮* @param {string} elId - DOM元素ID* @param {Object} option - ECharts配置项* @param {Object} highlightOptions - 自动高亮配置*/initEChartsWithAutoHighlight(elId, option, highlightOptions = {}) {const chart = this.$echarts.init(elId);chart.setOption(option);// 创建自动高亮实例const autoHighlight = createAutoHighlight(chart, highlightOptions);// 存储实例以便后续管理this.chartInstances.push(chart);this.autoHighlightInstances.push(autoHighlight);// 监听窗口大小变化,调整图表window.addEventListener('resize', () => {chart.resize();});return chart;}},beforeDestroy() {// 销毁所有图表和自动高亮实例this.autoHighlightInstances.forEach(instance => instance.destroy());this.chartInstances.forEach(chart => chart.dispose());this.autoHighlightInstances = [];this.chartInstances = [];}
};
引入的createAutoHighlight文件;
export function createAutoHighlight(chartInstance, options = {}) {const {dataIndexList = [],interval = 3000, // 轮播间隔时间(ms)} = options;let currentIndex = 0;let timer = null;let isPaused = false;// 获取数据长度const series = chartInstance.getOption().series || [];const data = series[0]?.data || [];const dataLength = data.length;// 如果未指定索引列表,则使用全部索引const indexes = dataIndexList.length > 0 ? dataIndexList.filter(idx => idx < dataLength) // 过滤无效索引: Array.from({ length: dataLength }, (_, i) => i);const total = indexes.length;// 处理空数据或单数据场景if (total <= 1) {return {start: () => {},pause: () => {},destroy: () => {}};}// 清除定时器function clearTimer() {if (timer) {clearTimeout(timer);timer = null;}}// 高亮指定索引function highlight(index) {// 清除之前的高亮chartInstance.dispatchAction({type: 'downplay',seriesIndex: 0,dataIndex: indexes[currentIndex]});// 更新当前索引currentIndex = index;// 高亮当前chartInstance.dispatchAction({type: 'highlight',seriesIndex: 0,dataIndex: indexes[currentIndex]});// 显示提示框chartInstance.dispatchAction({type: 'showTip',seriesIndex: 0,dataIndex: indexes[currentIndex]});}// 安排下一次高亮function scheduleNext() {if (isPaused) return;// 计算下一个索引const nextIndex = (currentIndex + 1) % total;// 设置定时器clearTimer();timer = setTimeout(() => {highlight(nextIndex);scheduleNext(); // 递归安排下一次}, interval);}// 开始轮播function start() {isPaused = false;// 如果已经在运行,先清除clearTimer();// 高亮第一个并安排下一次highlight(0);scheduleNext();}// 暂停轮播function pause() {isPaused = true;clearTimer();}// 销毁function destroy() {pause();chartInstance = null;}// 初始化start();// 监听鼠标事件chartInstance.on('mouseover', () => pause());chartInstance.on('mouseout', () => {// 只有在暂停状态下才恢复if (isPaused) {scheduleNext();isPaused = false;}});return {start,pause,destroy};}字体设置:
父组件:
import { fontChart } from "@/utils/echartPxToRem";
echartPxToRem 文件:
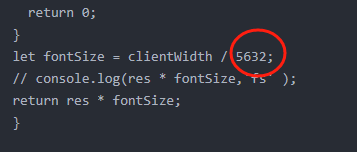
// 字体转换 px -> rem 计算echarts字体大小
export function fontChart(res) {let clientWidth = window.innerWidth || document.body.clientWidth; //屏幕尺寸if (!clientWidth) {return 0;}let fontSize = clientWidth / 5632;// console.log(res * fontSize,'fs' );return res * fontSize;}
改为 适配屏幕宽度: