WPF基于LiveCharts2图形库,实现:折线图,柱状图,饼状图
WPF基于LiveCharts2图形库,实现:折线图,柱状图,饼状图
- 使用流程
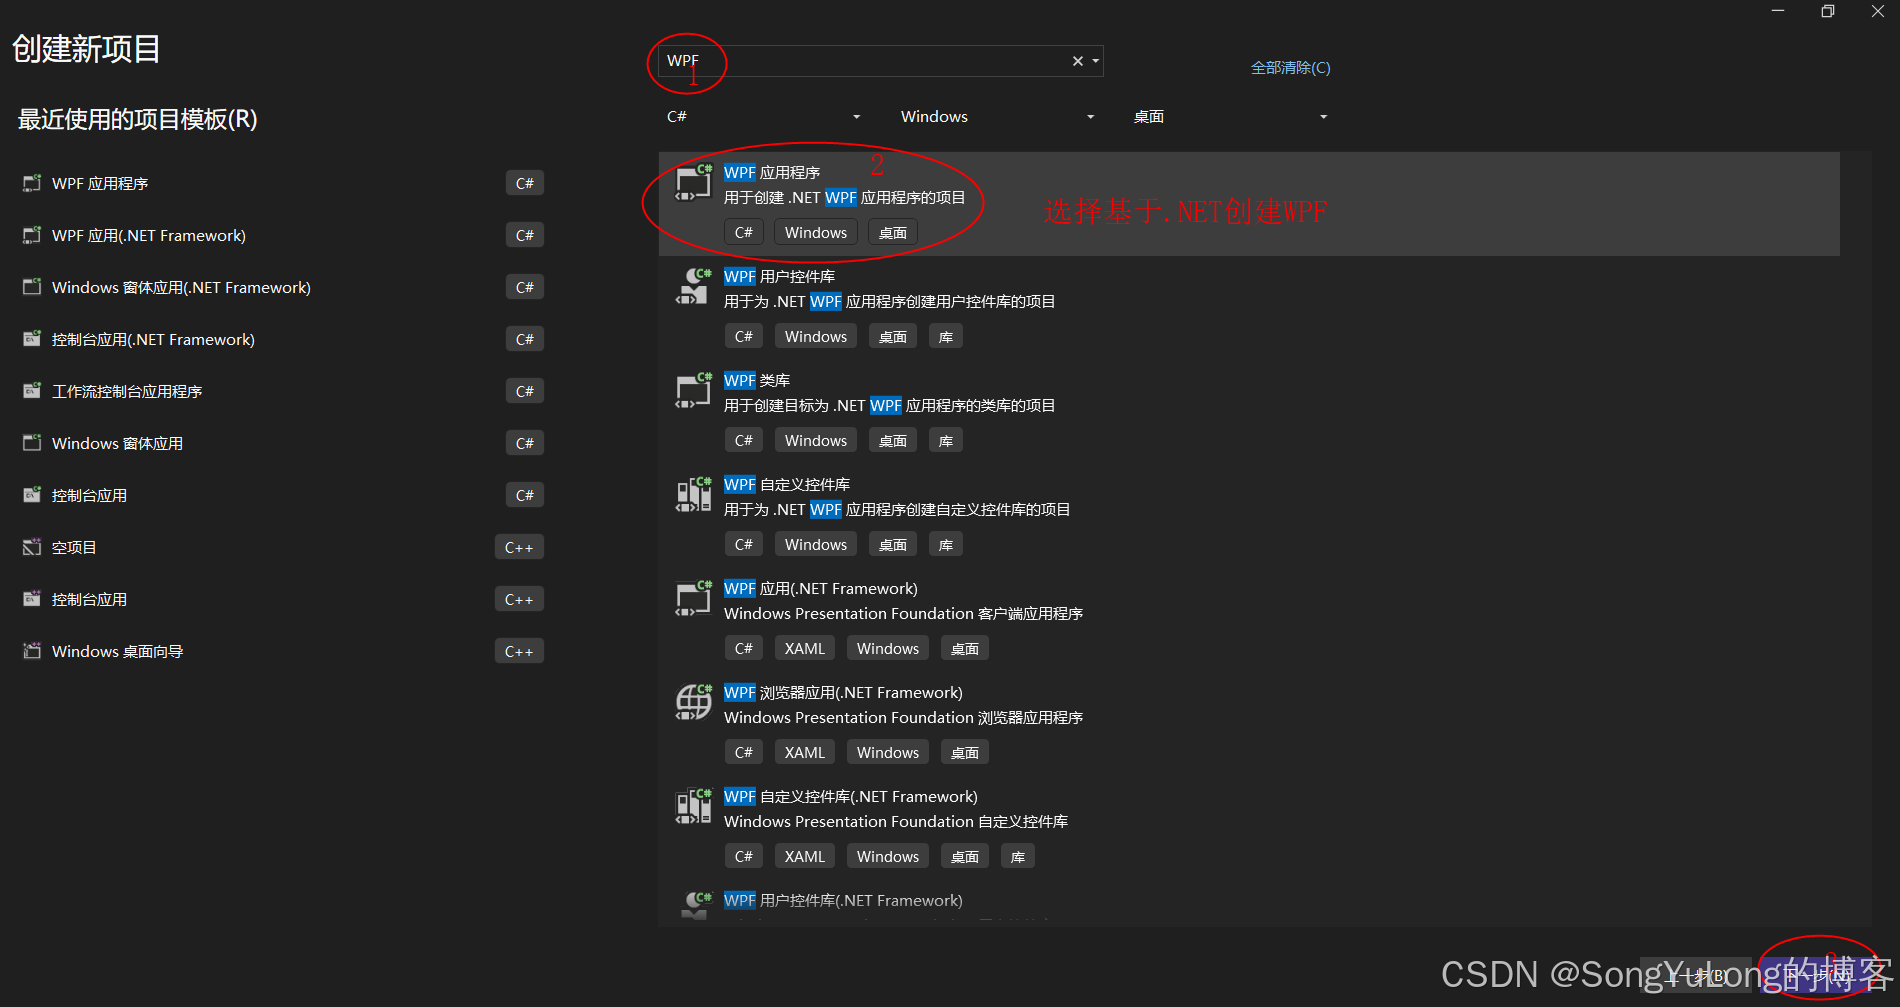
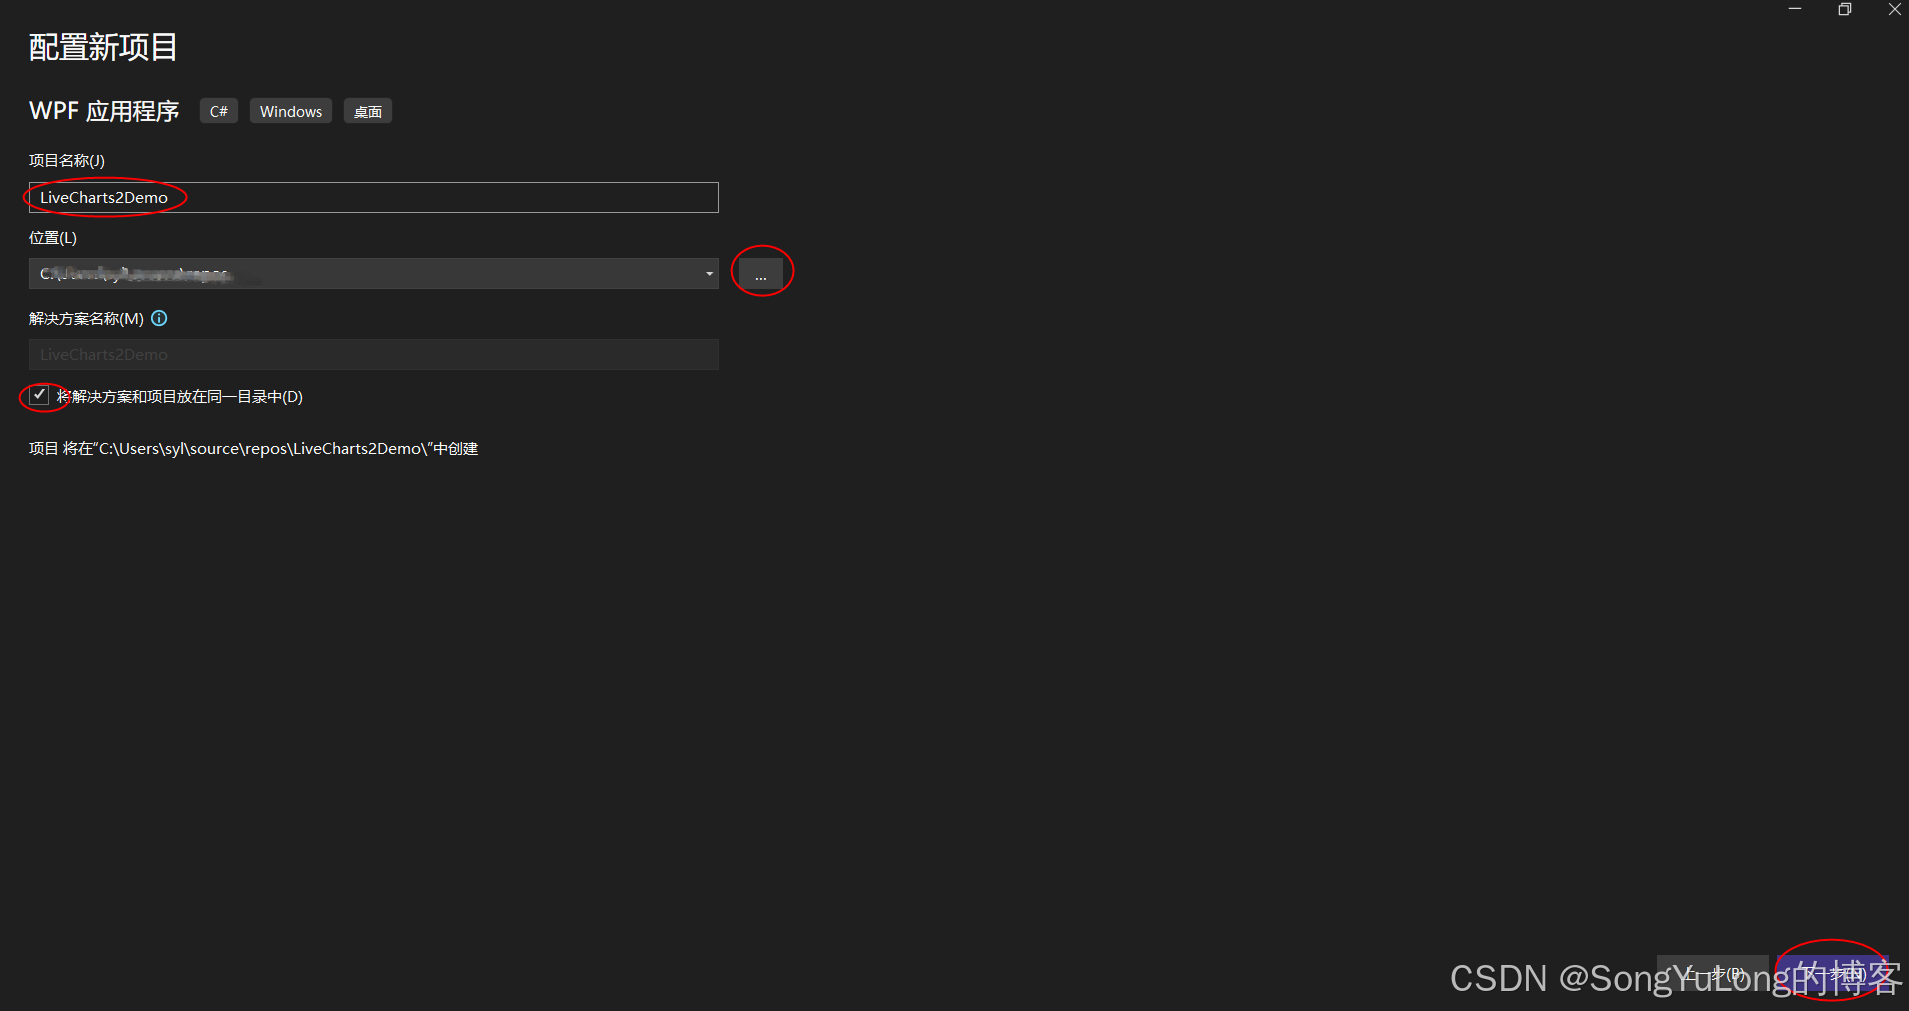
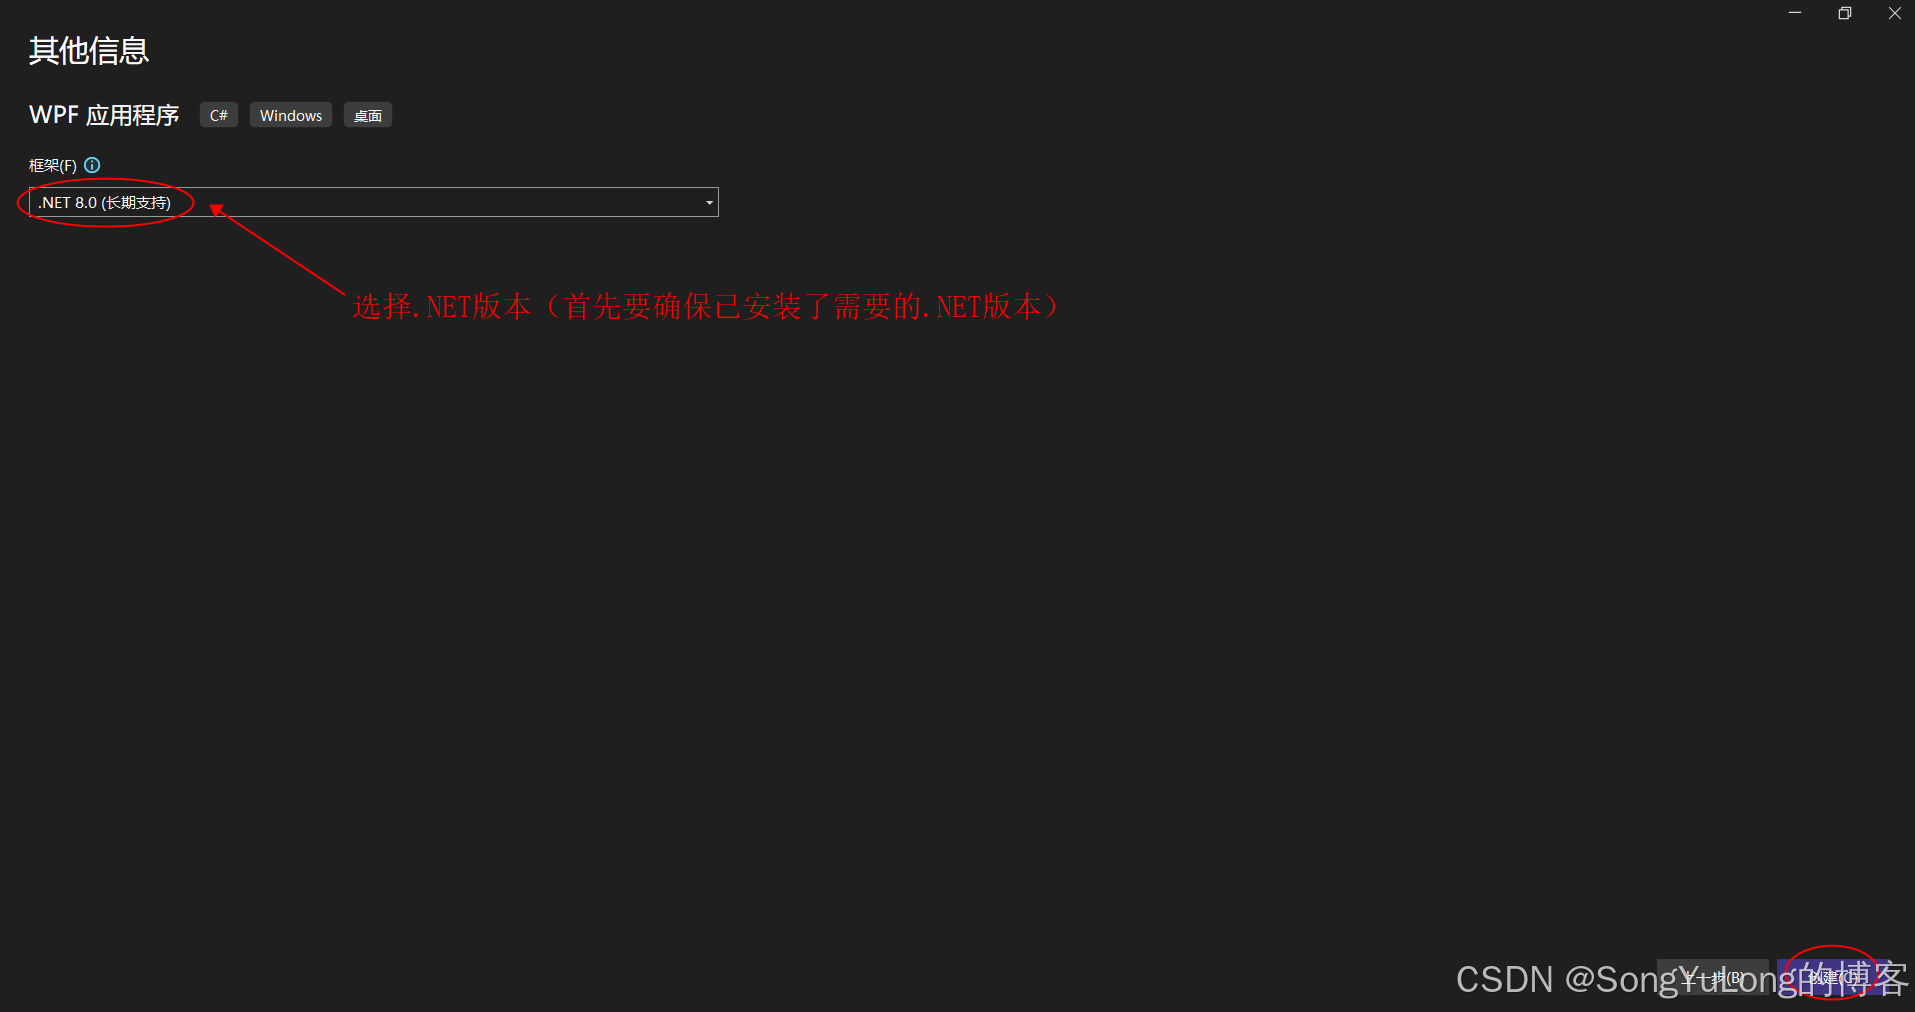
- 创建工程
- 安装LiveCharts2图形库
- 解决中文乱码
- 添加类文件
- 运行效果
使用流程
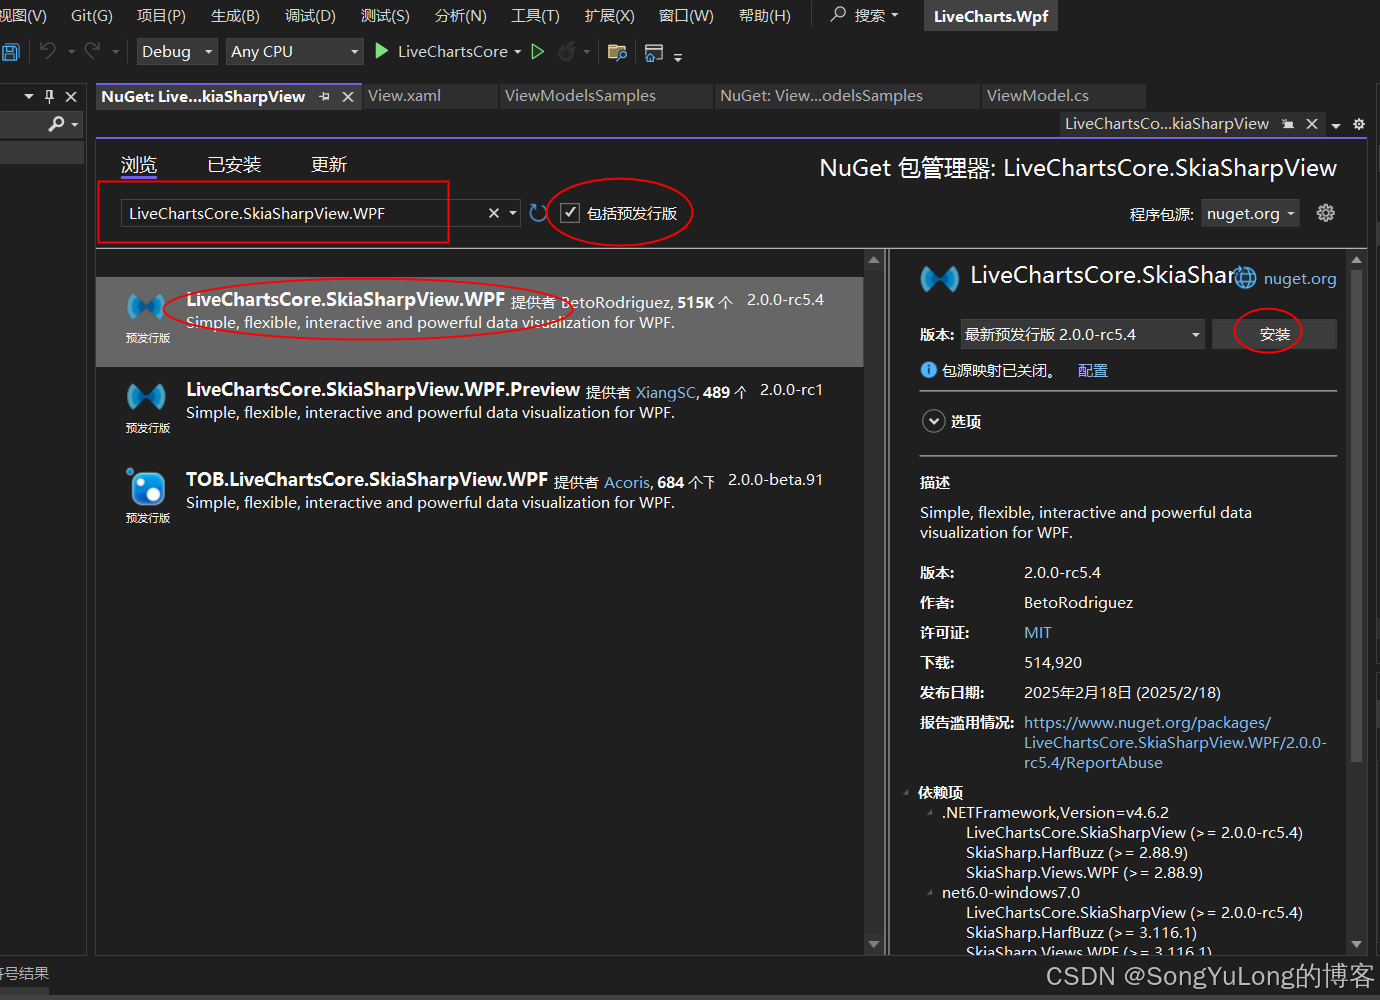
1.安装LiveCharts2:NuGet包管理器搜索下载LiveChartsCore.SkiaSharpView.WPF
3.解决中文显示方框,添加LiveCharts.Configure(config => config.HasGlobalSKTypeface(SKFontManager.Default.MatchCharacter(‘汉’)));
4.添加名字空间声明xmlns:lvc=“clr-namespace:LiveChartsCore.SkiaSharpView.WPF;assembly=LiveChartsCore.SkiaSharpView.WPF”
5.创建视图基类
6.创建视图图表类
7.创建视图管理类
8.实例化视图图表类
创建工程
安装LiveCharts2图形库
在NuGet包管理器搜索LiveChartsCore.SkiaSharpView.WPF,一般要勾选“包括预发行版”
解决中文乱码
1.全局修改
在App.xaml.cs文件复写OnStartup方法,添加LiveCharts.Configure(config => config.HasGlobalSKTypeface(SKFontManager.Default.MatchCharacter(‘汉’)));
public partial class App : Application
{public static IHost? Host { get; private set; }protected override void OnStartup(StartupEventArgs e){// 设置全局中文字体LiveCharts.Configure(config => config.HasGlobalSKTypeface(SKFontManager.Default.MatchCharacter('汉')));base.OnStartup(e);}
}
2.局部修改(不影响其他模块)
在MainWindow.xaml.cs文件的构造方法里添加LiveCharts.Configure(config => config.HasGlobalSKTypeface(SKFontManager.Default.MatchCharacter(‘汉’)));
public MainWindow()
{// 设置中文LiveCharts.Configure(config => config.HasGlobalSKTypeface(SKFontManager.Default.MatchCharacter('汉')));InitializeComponent();
}
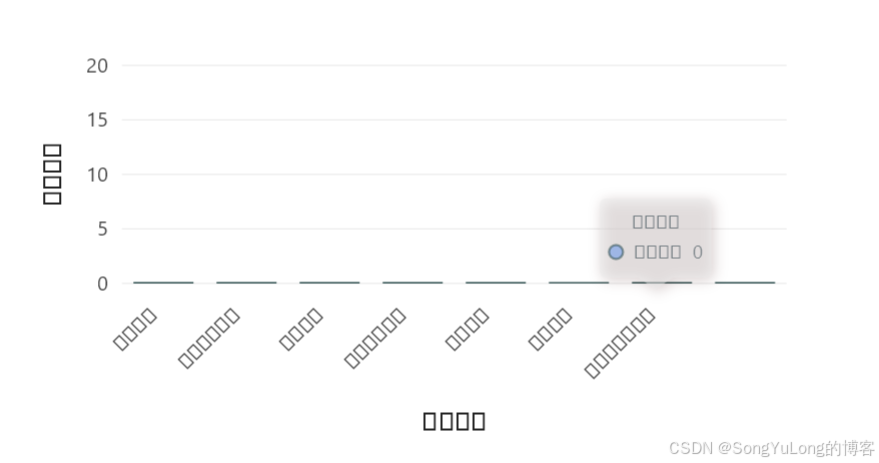
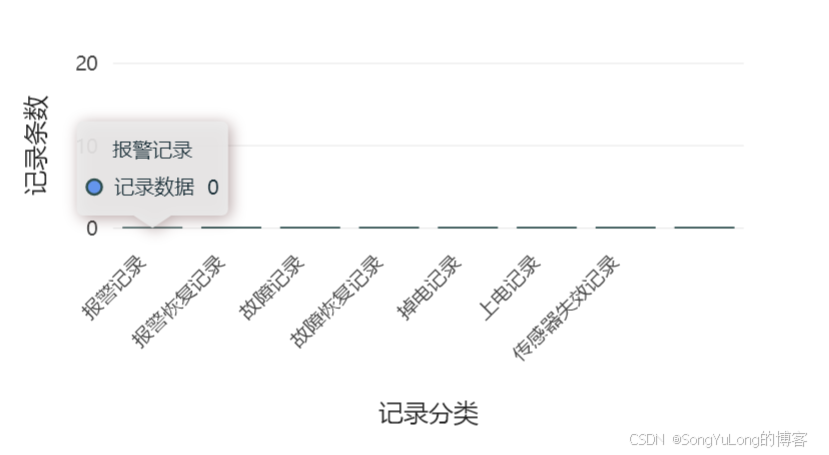
实测验证两种方法均可解决中文显示方框的问题
添加类文件
图表视图基类:ChartBaseViewModel.cs
// ChartBaseViewModel.cs
using LiveChartsCore;
using System.ComponentModel;
using System.Runtime.CompilerServices;namespace LiveCharts2Demo
{public abstract class ChartBaseViewModel : INotifyPropertyChanged{public abstract ISeries[] Series { get; }public event PropertyChangedEventHandler PropertyChanged;protected virtual void OnPropertyChanged([CallerMemberName] string name = null){PropertyChanged?.Invoke(this, new PropertyChangedEventArgs(name));}}
}
折线图视图类:LineChartViewModel.cs
using System;
using System.Collections.Generic;
using System.Linq;
using System.Text;
using System.Threading.Tasks;using LiveChartsCore;
using LiveChartsCore.SkiaSharpView;
using LiveChartsCore.SkiaSharpView.Painting;
using SkiaSharp;
using System.Collections.ObjectModel;
using System.ComponentModel;namespace LiveCharts2Demo
{public class LineChartViewModel : ChartBaseViewModel{private readonly ObservableCollection<double> _values;private readonly int _maxPoints;public override ISeries[] Series { get; }public LineChartViewModel(int maxPoints = 100){_maxPoints = maxPoints;_values = new ObservableCollection<double>();Series = new ISeries[]{new LineSeries<double>{Values = _values,Name = "随机值",Stroke = new SolidColorPaint(SKColors.Blue, 1),Fill = null,GeometrySize = 0,LineSmoothness = 0.7,   // 折线平滑度 0 - 1}};}// 配置 X 轴public Axis[] XAexs { get; set; } = new Axis[]{new Axis{Name = "X-轴",MinLimit = 0,MaxLimit = 100,MinStep = 0.1,               }};// 配置 Y 轴public Axis[] YAexs { get; set; } = new Axis[]{ new Axis{ Name = "Y轴"}};public void AddPoint(double value){_values.Add(value);while (_values.Count > _maxPoints)_values.RemoveAt(0);}public void Clear() => _values.Clear();}
}
柱状图视图类:BarChartViewModel.cs
using System;
using System.Collections.Generic;
using System.Linq;
using System.Text;
using System.Threading.Tasks;using LiveChartsCore;
using LiveChartsCore.SkiaSharpView;
using LiveChartsCore.SkiaSharpView.Painting;
using SkiaSharp;
using System.Collections.ObjectModel;
using System.ComponentModel;
using LiveChartsCore.Measure;namespace LiveCharts2Demo
{public class BarChartViewModel : ChartBaseViewModel{private readonly ObservableCollection<double> _values;public override ISeries[] Series { get; }// 可绑定到X轴标签public string[] Labels { get; set; }public Axis[] XAxes { get; set; }public Axis[] YAxes { get; set; }public BarChartViewModel(){_values = new ObservableCollection<double> {3, 6, 4, 8, 5};Labels = new[] { "A", "B", "C", "D", "E"};Series = new ISeries[]{new ColumnSeries<double>{Values = _values,Name = "测试数据",Stroke = new SolidColorPaint(SKColors.DarkSlateGray, 2),Fill = new SolidColorPaint(SKColors.CornflowerBlue)}};// 初始化 X 轴XAxes = new Axis[]{new Axis{Labels = Labels,LabelsRotation = -45, // 标签旋转角度Name = "分类"}};// 初始化 Y 轴YAxes = new Axis[] {new Axis{MinLimit = 0,MaxLimit = 20,Name = "数值",                    }};}/// <summary>/// 更新指定索引的值/// </summary>/// <param name="index"></param>/// <param name="value"></param>public void UpdateValue(int index, double value){if (index >= 0 && index < _values.Count){_values[index] = value;}else{_values.Add(value);// 动态扩展}}/// <summary>/// 随机动态更新(用于演示)/// </summary>public void RandomUpdate(){var rand = new Random();for (int i = 0; i < _values.Count; i++){UpdateValue(i, rand.Next(1, 10));}}}
}
饼状图视图类:PieChartViewModel.cs
using System;
using System.Collections.Generic;
using System.Linq;
using System.Text;
using System.Threading.Tasks;using LiveChartsCore;
using LiveChartsCore.SkiaSharpView;
using LiveChartsCore.SkiaSharpView.Painting;
using SkiaSharp;
using System.Collections.ObjectModel;
using System.ComponentModel;namespace LiveCharts2Demo
{public class PieChartViewModel : ChartBaseViewModel{private readonly ObservableCollection<double> _values;public override ISeries[] Series { get; }public PieChartViewModel(){_values = new ObservableCollection<double> { 3, 7, 5 };Series = new ISeries[]{new PieSeries<double>{Values = _values,  // 数据集合决定每个扇区的大小Name = "系列1",    // 系列名称,通常用于图例显示Fill = new SolidColorPaint(new SKColor(255, 99, 71)), // 设置扇区的颜色 番茄红Stroke = new SolidColorPaint(SKColors.Black, 1),  // 设置扇区边框的颜色和宽度DataLabelsPaint = new SolidColorPaint(SKColors.Red), // 设置数据标签文字的颜色                   InnerRadius = 0.5,  // 设置内半径为饼图的一半,从而形成环形图效果RelativeInnerRadius = 0.8,RelativeOuterRadius = 0.6,Pushout = 10,  // 当鼠标悬停在某个扇区上时,该扇区突出显示的距离HoverPushout = 5, // 鼠标悬停时额外推出的距离AnimationsSpeed = TimeSpan.FromMicroseconds(500),},new PieSeries<double>{Values = _values,Name = "系列2",Fill = new SolidColorPaint(new SKColor(54, 162, 235)), // 天蓝Stroke = new SolidColorPaint(SKColors.Black, 1),InnerRadius = 0.5,OuterRadiusOffset = 0.5,},new PieSeries<double>{Values = _values,Name = "系列3",Fill = new SolidColorPaint(SKColors.YellowGreen, 2),//Stroke = new SolidColorPaint(new SKColors.Blue, 1),//MaxOuterRadiusPercentage = 0.6}};}/// <summary>/// 更新第index个扇区的值/// </summary>/// <param name="index"></param>/// <param name="value"></param>public void UpdateSector(int index, double value){if (index >= 0 && index < _values.Count){_values[index] = value;}}public void RandomUpdate(){var rand = new Random();for (int i = 0; i < _values.Count; i++){UpdateSector(i, rand.Next(1, 10));}}}
}
视图管理:MainViewModel.cs
using System;
using System.Collections.Generic;
using System.ComponentModel;
using System.Linq;
using System.Runtime.CompilerServices;
using System.Text;
using System.Threading.Tasks;namespace LiveCharts2Demo
{public class MainViewModel : INotifyPropertyChanged{public LineChartViewModel LineChart { get; } = new(100);public BarChartViewModel BarChart { get; } = new();public PieChartViewModel PieChart { get; } = new();public event PropertyChangedEventHandler PropertyChanged;protected virtual void OnPropertyChanged([CallerMemberName] string name = null){PropertyChanged?.Invoke(this, new PropertyChangedEventArgs(name));}}
}
MainWindow.xaml
<Window x:Class="LiveCharts2Demo.MainWindow"xmlns="http://schemas.microsoft.com/winfx/2006/xaml/presentation"xmlns:x="http://schemas.microsoft.com/winfx/2006/xaml"xmlns:d="http://schemas.microsoft.com/expression/blend/2008"xmlns:mc="http://schemas.openxmlformats.org/markup-compatibility/2006"xmlns:lvc="clr-namespace:LiveChartsCore.SkiaSharpView.WPF;assembly=LiveChartsCore.SkiaSharpView.WPF"xmlns:local="clr-namespace:LiveCharts2Demo"mc:Ignorable="d"Title="MainWindow" Height="450" Width="800"><Window.DataContext><local:MainViewModel/></Window.DataContext><Grid><Grid.ColumnDefinitions><ColumnDefinition/><ColumnDefinition/></Grid.ColumnDefinitions><Grid.RowDefinitions><RowDefinition Height="*"/><RowDefinition Height="*"/><RowDefinition Height="*"/></Grid.RowDefinitions><!-- 折线图 --><lvc:CartesianChart Grid.Row="0" Grid.Column="0" Margin="10" Series="{Binding LineChart.Series}"XAxes="{Binding LineChart.XAexs}"YAxes="{Binding LineChart.YAexs}"/><!-- 柱状图 --><lvc:CartesianChartGrid.Row="0" Grid.Column="1"Margin="10" LegendPosition="Right" Series="{Binding BarChart.Series}"XAxes="{Binding BarChart.XAxes}"YAxes="{Binding BarChart.YAxes}"></lvc:CartesianChart><!-- 饼状图 --><lvc:PieChart Grid.Row="1" Grid.Column="0" Grid.ColumnSpan="2"LegendPosition="Bottom"Margin="10"                    Series="{Binding PieChart.Series}"/><StackPanel Grid.Row="2" Grid.Column="0" Grid.ColumnSpan="2"Orientation="Horizontal"HorizontalAlignment="Center"VerticalAlignment="Center"><Button Content="更新柱状图" x:Name="btnBarChartUpdate" Click="btnBarChartUpdate_Click" Margin="5"/><Button Content="更新饼状图" x:Name="btnPieChartUpdate" Click="btnPieChartUpdate_Click" Margin="5"/></StackPanel></Grid>
</Window>
MainWindow.cs
using System.Text;
using System.Windows;
using System.Windows.Controls;
using System.Windows.Data;
using System.Windows.Documents;
using System.Windows.Input;
using System.Windows.Media;
using System.Windows.Media.Imaging;
using System.Windows.Navigation;
using System.Windows.Shapes;using LiveChartsCore;
using LiveChartsCore.SkiaSharpView;
using LiveChartsCore.SkiaSharpView.Painting;
using LiveChartsCore.SkiaSharpView.WPF;
using LiveChartsCore.Measure;using SkiaSharp;
using System.Collections.ObjectModel;
using System.ComponentModel;
using System.Runtime.CompilerServices;
using System.Windows.Threading;namespace LiveCharts2Demo
{/// <summary>/// Interaction logic for MainWindow.xaml/// </summary>public partial class MainWindow : Window{private readonly MainViewModel _vm;private readonly DispatcherTimer _timer;private double _phase = 0;public MainWindow(){// 设置全局字体-中文LiveCharts.Configure(config => config.HasGlobalSKTypeface(SKFontManager.Default.MatchCharacter('汉')));InitializeComponent();_vm = (MainViewModel)DataContext;// 动态修改图表参数_vm.LineChart.Series[0].Name = "波形图1";_vm.LineChart.XAexs[0].MinLimit = 0;_vm.LineChart.XAexs[0].MaxLimit = 200;// 模拟折线图动态数据更新_timer = new DispatcherTimer();_timer.Interval = TimeSpan.FromMilliseconds(200);_timer.Tick += (s, e) =>{//double value = Math.Sin(_phase) + (new Random().NextDouble() - 0.5) * 0.2;double value = (new Random().NextDouble()) * 100;_vm.LineChart.AddPoint(value);_phase += 0.5;};_timer.Start();}protected override void OnClosed(EventArgs e){_timer.Stop();base.OnClosed(e);}private void btnBarChartUpdate_Click(object sender, RoutedEventArgs e){_vm.BarChart.RandomUpdate();}private void btnPieChartUpdate_Click(object sender, RoutedEventArgs e){_vm.PieChart.RandomUpdate();}}
}
运行效果