openlayer:11点击地图上省份实现overlay提示省份名称并修改对应所点省份区域颜色
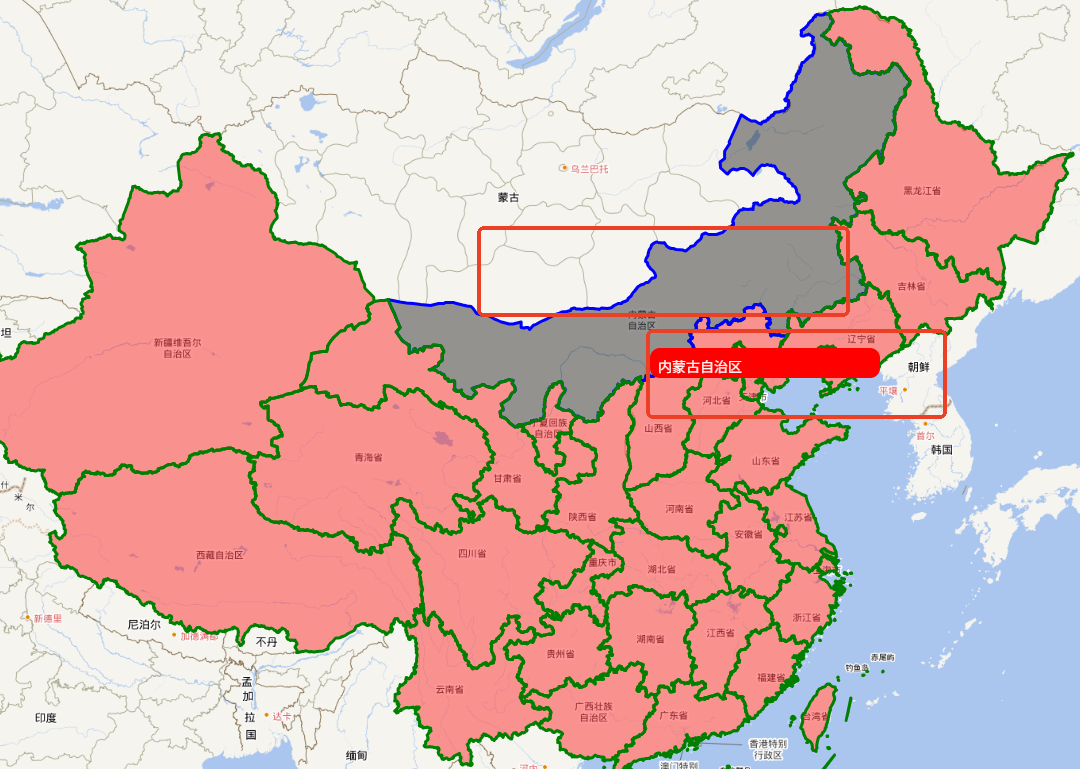
点击map地图上省份,并利用overlay弹窗提示省份名称,同时改变所点省份区域颜色。
本文介绍了如何通过OpenLayers库实现点击地图省份并显示弹窗提示省份名称,同时改变所点省份区域颜色的功能。首先,定义了全局变量map和popup,用于存储地图实例和弹窗。接着,通过useState定义name变量来存储省份名称。地图视图view设置了中心点和缩放级别,并加载了三个TileLayer图层,数据来源为天地图。矢量图层vectorlayer通过VectorSource加载GeoJSON格式的省份边界数据,并设置了样式。通过Overlay创建弹窗,并将其添加到地图中。地图的点击事件通过singleclick监听,获取点击位置的省份信息,更新name变量,并改变该省份的样式,最后显示弹窗。完整代码展示了如何将这些功能整合到一个React组件中。
一、解释
let map=null;
let popupp=null;定义全局变量map和popup弹窗,方便后面直接使用该变量
const [name,setname]=useState('');state中定义name
用来存储省份名字let view=new View({center:fromLonLat([116.3903,39.9072]),zoom:4})定义view视图,设置center中心点let yingxianglayer=new TileLayer({source:new XYZ({url :"http://t3.tianditu.gov.cn/img_w/wmts?SERVICE=WMTS&REQUEST=GetTile&VERSION=1.0.0&LAYER=img&STYLE=default&TILEMATRIXSET=w&FORMAT=tiles&TILEMATRIX={z}&TILEROW={y}&TILECOL={x}&tk=528881a2c3d647268c04ab43dc46bd51"})})let ditulayer=new TileLayer({source:new XYZ({url :"http://t5.tianditu.gov.cn/vec_w/wmts?SERVICE=WMTS&REQUEST=GetTile&VERSION=1.0.0&LAYER=vec&STYLE=default&TILEMATRIXSET=w&FORMAT=tiles&TILEMATRIX={z}&TILEROW={y}&TILECOL={x}&tk=528881a2c3d647268c04ab43dc46bd51"})})let biaojilayer=new TileLayer({source:new XYZ({url :"http://t3.tianditu.com/DataServer?T=cva_w&tk=faf4cf166d31edcaba5de523eae8084f&x={x}&y={y}&l={z}"})})设置三个tilelayer图层,数据来源天地图。
url中数据具体可以去天地图官网获取。let vectorsource=new VectorSource({url:"https://geo.datav.aliyun.com/areas_v3/bound/100000_full.json",format:new GeoJSON()})let vectorlayer=new VectorLayer({source:vectorsource,style:new Style({fill:new Fill({color:"rgba(255,0,0,0.4)"}),stroke:new Stroke({color:'green',width:3})})})设置矢量图层,并设置style,这样可以更明显看出范围
VectorSource中url来自dataV
format:new GeoJSON()是一种坐标数据格式,最常用的就是GeoJSON格式popupp=new Overlay({element:document.getElementById("popupp"),
})
map.addOverlay(popupp)设置一个popup弹窗
并将popup弹窗添加到map中去map.on("singleclick",function(e){let features=vectorsource.getFeaturesAtCoordinate(e.coordinate);let allfeatures=vectorsource.getFeatures()allfeatures.map((item,index)=>{item.setStyle(new Style({fill:new Fill({color:"rgba(255,0,0,0.4)"}),stroke:new Stroke({color:'green',width:3})}))})if(features[0]){setname(features[0].get('name'));let location=features[0].get('center');console.log('location',location)features[0].setStyle(new Style({fill:new Fill({color:"rgba(0,0,0,0.4)"}),stroke:new Stroke({color:'blue',width:3})}) )popupp.setPosition(fromLonLat(location));map.addOverlay(popupp);}})map添加点击事件
并利用vectorsource.getFeaturesAtCoordinate获取features二、完整代码:
import { useState ,useEffect} from 'react';
import Map from 'ol/Map.js';
import View from 'ol/View.js';
import TileLayer from 'ol/layer/Tile.js';
import XYZ from 'ol/source/XYZ.js';
import VectorLayer from 'ol/layer/Vector.js';
import VectorSource from 'ol/source/Vector.js';
import GeoJSON from 'ol/format/GeoJSON.js';
import Style from 'ol/style/Style.js';
import Fill from 'ol/style/Fill.js';
import Stroke from 'ol/style/Stroke.js';
import Icon from 'ol/style/Icon.js';
import Feature from 'ol/Feature.js';
import Polygon from 'ol/geom/Polygon.js';
import Point from 'ol/geom/Point.js';
import Overlay from 'ol/Overlay.js';
import {fromLonLat} from 'ol/proj';
import './System.css'
import 'ol/ol.css';
let map=null;
let popupp=null;
function System() {const [name,setname]=useState('');let view=new View({center:fromLonLat([116.3903,39.9072]),zoom:4})let yingxianglayer=new TileLayer({source:new XYZ({url :"http://t3.tianditu.gov.cn/img_w/wmts?SERVICE=WMTS&REQUEST=GetTile&VERSION=1.0.0&LAYER=img&STYLE=default&TILEMATRIXSET=w&FORMAT=tiles&TILEMATRIX={z}&TILEROW={y}&TILECOL={x}&tk=528881a2c3d647268c04ab43dc46bd51"})})let ditulayer=new TileLayer({source:new XYZ({url :"http://t5.tianditu.gov.cn/vec_w/wmts?SERVICE=WMTS&REQUEST=GetTile&VERSION=1.0.0&LAYER=vec&STYLE=default&TILEMATRIXSET=w&FORMAT=tiles&TILEMATRIX={z}&TILEROW={y}&TILECOL={x}&tk=528881a2c3d647268c04ab43dc46bd51"})})let biaojilayer=new TileLayer({source:new XYZ({url :"http://t3.tianditu.com/DataServer?T=cva_w&tk=faf4cf166d31edcaba5de523eae8084f&x={x}&y={y}&l={z}"})})let vectorsource=new VectorSource({url:"https://geo.datav.aliyun.com/areas_v3/bound/100000_full.json",format:new GeoJSON()})let vectorlayer=new VectorLayer({source:vectorsource,style:new Style({fill:new Fill({color:"rgba(255,0,0,0.4)"}),stroke:new Stroke({color:'green',width:3})})})useEffect(()=>{map=new Map({target:"mapp",view:view,layers:[yingxianglayer,ditulayer,biaojilayer,vectorlayer]})popupp=new Overlay({element:document.getElementById("popupp"),})map.addOverlay(popupp)map.on("singleclick",function(e){let features=vectorsource.getFeaturesAtCoordinate(e.coordinate);let allfeatures=vectorsource.getFeatures()allfeatures.map((item,index)=>{item.setStyle(new Style({fill:new Fill({color:"rgba(255,0,0,0.4)"}),stroke:new Stroke({color:'green',width:3})}))})if(features[0]){setname(features[0].get('name'));let location=features[0].get('center');console.log('location',location)features[0].setStyle(new Style({fill:new Fill({color:"rgba(0,0,0,0.4)"}),stroke:new Stroke({color:'blue',width:3})})   )popupp.setPosition(fromLonLat(location));map.addOverlay(popupp);}})},[])return (<><div id="mapp" style={{width: "100%",height: "97vh"}}><div id="popupp">{name}</div></div></>)
}export default System