基于脑功能连接组和结构连接组的可解释特定模态及交互图卷积网络|文献速递-深度学习医疗AI最新文献
Title
题目
Interpretable modality-specific and interactive graph convolutional networkon brain functional and structural connectomes
基于脑功能连接组和结构连接组的可解释特定模态及交互图卷积网络
01
文献速递介绍
人类连接组将大脑的功能和结构组织描绘为大规模的复杂脑网络(斯波恩斯等人,2005)。这样的连接组在很大程度上依赖神经成像技术来进行准确描述。具体而言,静息态功能磁共振成像(rs-fMRI)测量血氧水平依赖(BOLD)信号的自发波动,从而产生跨脑区的功能连接(阿萨夫和帕斯捷尔纳克,2008)。弥散张量成像(DTI)描绘了连接不同脑区的白质纤维束,进而产生结构连接(洛戈塞蒂斯,2008)。脑结构连接和功能连接都与特定的变化相关,并揭示了认知方面独特的标志物(达马拉等人,2021;奥伊等人,2022;林等人,2020b),例如流体认知,或神经系统疾病(陈等人,2022;赫林顿等人,2017),如帕金森病(PD)、阿尔茨海默病(AD)和精神分裂症(SZ)。此外,考虑到结构连接和功能连接之间的补偿机制(赫林顿等人,结构连接和功能连接的配对区域之间的相互作用与认知的改善(鲍姆等人,2020)或神经系统疾病的变化(扎尔卡利等人,2021)相关。理解潜在结构如何支持高级认知功能的发展,以及结构-功能耦合在不同神经系统疾病中如何变化,在脑连接组研究中至关重要。利用结构-功能相互作用和单一模态的特定特征来预测认知情况,或者对患有神经系统疾病的患者和健康个体进行分类,可能有助于检测出比使用单一模态更敏感的脑连接细微中断。最终,它可以提高回归或分类的准确性,增进我们对认知和神经系统疾病的神经解剖学和神经生理学基础的理解。 功能连接和结构连接都将大脑建模为一个复杂网络。由于脑网络可以表示为一个图,其中感兴趣的脑区(ROI)作为由边连接的节点,构建这种回归或分类模型最广泛使用的架构之一是图神经网络(GNN)(基普夫和韦林,2016)。由于具有从图域的特征相互作用中提取结构特征的能力,图神经网络在认知预测和脑部疾病分类方面表现出色(姚等人,2021;孔等人,2021;温等人,2022;萨法伊等人,2022)。目前,大多数基于图神经网络的脑连接研究都集中在单一成像模态上,并且它们往往难以捕捉功能连接和结构连接之间的相互作用。 一般来说,利用图神经网络进行多连接组分析可以加强对高级潜在和复杂表示的探索,从而提高性能。然而,这一特点尚未得到充分研究。例如,多模态图卷积网络(M-GCN)(德索萨等人,2021)、多视图图卷积网络(MV-GCN)(张等人,2018)和超图神经网络(HGNN)(冯等人,2019)被应用于多模态融合以进行分类或回归。然而,它们缺乏捕捉和充分利用结构连接和功能连接之间相互作用的能力。跨图神经网络(Cross-GNN)(杨等人,2023)和联合图卷积网络(Joint-GCN)(李等人,2022)利用融合函数或可学习的方法来捕捉模态间的依赖关系,并应用于表型预测或疾病分类。然而,它们仍然缺乏对结构连接和功能连接的特定模态嵌入的利用。一种既结合了反映每个模态针对任务的独特神经机制的特定模态信息,又考虑了模态间相互作用(表达了白质纤维束为高级脑功能提供的潜在基础)的方法是非常必要的。此外,阐明显著的相互作用对于理解认知和神经系统疾病的潜在生物标志物至关重要。然而,在现有的基于深度学习的方法中,这一点尚未得到很好的研究。 因此,我们提出了一种可解释的特定模态及交互图卷积网络(MS-Inter-GCN),如图1所示,以在利用特定模态特征的同时学习结构连接和功能连接之间的交互权重。我们设计了一个图卷积编码器-解码器模块,确保输出与真实标签紧密对齐。该模块分别应用于结构连接和功能连接,以提取特定模态的任务相关嵌入。随后,使用一个类似于瓶颈结构的多层感知器(MLP)模块的交互模块来学习结构连接和功能连接相应区域之间的交互权重。较高的交互权重表示两种模态的相应区域之间更强的耦合强度。通过插入交互权重作为连接结构连接和功能连接相应区域的边,我们构建了一个交互图。这个图不仅反映了节点的特定模态任务相关嵌入,还整合了学习到的它们之间的耦合强度。随后,在交互图上使用一层图卷积模块进行回归或分类。为了增强MS-Inter-GCN的可解释性,使用GNNExplainer(英等人,2019)进行事后解释实验,该实验识别出在回归或分类中起关键作用的由一小部分节点和边组成的紧凑子图结构。实现我们方法的代码可在https://github.com/xiajing0904/GCN-FS-fusion.git获取。 我们基于人类连接组计划(HCP)数据集(838名受试者)进行了流体认知预测实验,基于帕金森病进展标志物倡议(PPMI)数据集(147名受试者)进行了帕金森病分类实验,基于阿尔茨海默病神经成像倡议(ADNI)数据集(205名受试者)进行了阿尔茨海默病分类实验,以及基于生物医学研究卓越中心(COBRE)数据集(132名受试者)进行了精神分裂症分类实验。我们将我们的框架与十种现有的最先进方法进行了比较,其中包括两种基于卷积神经网络的模型,如BrainNetCNN(川原等人,2017)和ML-Att-Net(夏等人,2023),五种最先进的基于图的多模态融合方法,如M-GCN(德索萨等人,2021)、HGNN(冯等人,2019)、Cross-GNN(杨等人,2023)、MV-GCN(张等人,2018)和Joint-GCN(李等人,2022),以及三种基于Transformer的方法,如视觉Transformer、GraphGPS(兰帕谢克等人,2022)和HGT(胡等人,2020)。结果表明,我们的MS-Inter-GCN超越了现有的多模态方法。此外,我们进行了消融研究以验证我们框架中的每个模块。对于功能连接和结构连接中的每一个,我们识别出了与流体认知、帕金森病、阿尔茨海默病和精神分裂症相关的显著区域和连接。我们进一步发现,前额叶、颞上叶和扣带回皮质的结构-功能耦合变化与流体认知显著相关,而前额叶、顶上叶和枕叶皮质的结构-功能耦合变化与帕金森病显著相关。此外,额中回和顶叶外侧皮质、颞极和皮质下区域的结构-功能解耦与阿尔茨海默病相关,而额上回、颞上极、枕中区域、楔叶、直回和小脑的解耦与精神分裂症相关。 总体而言,本研究有三个贡献: 1. 提出了一种新颖的特定模态及交互图卷积网络(MS-Inter-GCN),其具有专门为结构连接和功能连接设计的图编码器-解码器模块,可有效地捕捉特定模态的任务相关嵌入。 2. 提出了一种新颖的交互模块,其结合了卷积算子和类似于瓶颈结构的多层感知器。卷积算子从全局角度模拟结构连接和功能连接的成对任务相关节点嵌入之间的相互作用。同时,类似于瓶颈结构的多层感知器通过挤压和激励过程生成结构-功能耦合强度。 3. 构建了一个新颖的交互图,将特定模态的任务相关嵌入作为节点特征,将结构-功能相互作用作为连接结构连接和功能连接相应区域的边。 4. 应用了一种事后可解释方法来识别每个模态内的显著区域和连接,以及我们的模型学习到的结构-功能相互作用。它为与任务相关的特定模态和结构-功能交互生物标志物提供了见解。
Aastract
摘要
Both brain functional connectivity (FC) and structural connectivity (SC) provide distinct neural mechanisms forcognition and neurological disease. In addition, interactions between SC and FC within distributed associationregions are related to alterations in cognition or neurological diseases, considering the inherent linkagebetween neural function and structure. However, there is a scarcity of existing learning-based methods thatleverage both modality-specific characteristics and high-order interactions between the two modalities forregression or classification. Hence, this study proposes an interpretable modality-specific and interactive graphconvolutional network (MS-Inter-GCN) that incorporates modality-specific information, reflecting the uniqueneural mechanism for each modality, and structure–function interactions, capturing the underlying foundationprovided by white-matter fiber tracts for high-level brain function. In MS-Inter-GCN, we generate modalityspecific task-relevant embeddings separately from both FC and SC using a graph convolutional encoder–decodermodule. Subsequently, we learn the interactive weights between corresponding regions of FC and SC, reflectingthe coupling strength, by employing an interactive module on the embeddings of both modalities. A novel graphstructure is constructed, which uses modality-specific task-relevant embeddings and inserts the interactiveweights as edges connecting corresponding regions of two modalities, and then is used for the regression orclassification task. Finally, a post-hoc explainable technology - GNNExplainer- is used to identify salient regionsand connections of each modality as well as salient interactions between FC and SC associated with tasks. Weapply the proposed framework to fluid cognition prediction, Parkinson’s disease (PD), Alzheimer’s disease (AD),and schizophrenia (SZ) classification. Experimental results demonstrate that our method outperforms the otherten state-of-the-art methods on multi-modal brain features on all tasks. The GNNExplainer identifies salientstructural and functional regions and connections for fluid cognition, PD, AD, and SZ. It confirms that strongstructure–function coupling within the executive and control networks, combined with weak coupling withinthe motor network, is associated with fluid cognition. Moreover, structure–function decoupling in specific brainregions serves as a marker for different diseases: decoupling of the prefrontal, superior parietal, and superioroccipital cortices is a marker of PD; decoupling of the middle frontal and lateral parietal cortices, temporalpole, and subcortical regions is indicative of AD; and decoupling of the prefrontal, parietal, and temporalcortices, as well as the cerebellum, contributes to SZ.
脑功能连接(FC)和结构连接(SC)都为认知和神经系统疾病提供了不同的神经机制。此外,考虑到神经功能与结构之间的内在联系,分布式关联区域内的结构连接和功能连接之间的相互作用与认知或神经系统疾病的变化相关。然而,现有的基于学习的方法很少能够同时利用特定模态的特征以及两种模态之间的高阶相互作用来进行回归或分类。因此,本研究提出了一种可解释的特定模态交互图卷积网络(MS-Inter-GCN),该网络整合了特定模态的信息,反映了每个模态独特的神经机制,以及结构与功能之间的相互作用,捕捉了白质纤维束为高级脑功能提供的潜在基础。 在MS-Inter-GCN中,我们使用图卷积编码器-解码器模块分别从功能连接和结构连接中生成与特定模态和任务相关的嵌入。随后,我们通过在两种模态的嵌入上使用交互模块来学习功能连接和结构连接相应区域之间的交互权重,这些权重反映了耦合强度。构建了一种新颖的图结构,该结构使用特定模态和任务相关的嵌入,并插入交互权重作为连接两种模态相应区域的边,然后用于回归或分类任务。 最后,采用一种事后可解释技术——GNNExplainer,来识别每个模态的显著区域和连接,以及功能连接和结构连接之间与任务相关的显著交互。我们将所提出的框架应用于流体认知预测、帕金森病(PD)、阿尔茨海默病(AD)和精神分裂症(SZ)的分类。实验结果表明,在所有任务中,我们的方法在多模态脑特征方面优于其他十种最先进的方法。GNNExplainer识别出了与流体认知、帕金森病、阿尔茨海默病和精神分裂症相关的显著结构和功能区域及连接。研究证实,执行和控制网络内较强的结构-功能耦合,以及运动网络内较弱的耦合,与流体认知相关。此外,特定脑区的结构-功能解耦可作为不同疾病的标志物:前额叶、顶上叶和枕上叶皮质的解耦是帕金森病的标志物;额中回、顶叶外侧皮质、颞极和皮质下区域的解耦是阿尔茨海默病的指示标志;而前额叶、顶叶和颞叶皮质以及小脑的解耦与精神分裂症有关。
Method
方法
Fig. 1 shows the overall framework. Given the brain FC and SC, agraph convolutional encoder–decoder module is employed separatelyto extract task-relevant embeddings for each modality. Then, an interactive module is designed to learn the interactions between thecorresponding regions of SC and FC. By incorporating the modalityspecific embeddings as new node features and learned weights asedges linking the corresponding nodes of FC and SC, an interactivegraph is constructed to produce the final regression or classification.Finally, GNNExplainer is applied to identify relevant regions and connections within each modality, and interactions between modalitiesthat contribute to regression or classification.
图1展示了总体框架。给定大脑的功能连接(FC)和结构连接(SC),分别使用图卷积编码器-解码器模块来提取每个模态与任务相关的嵌入。然后,设计一个交互模块来学习结构连接(SC)和功能连接(FC)相应区域之间的相互作用。通过将特定模态的嵌入作为新的节点特征,并将学习到的权重作为连接功能连接(FC)和结构连接(SC)相应节点的边,构建一个交互图,以得出最终的回归结果或进行分类。最后,应用图神经网络解释器(GNNExplainer)来识别每个模态内的相关区域和连接,以及对回归或分类有贡献的模态间的相互作用。
Figure
图
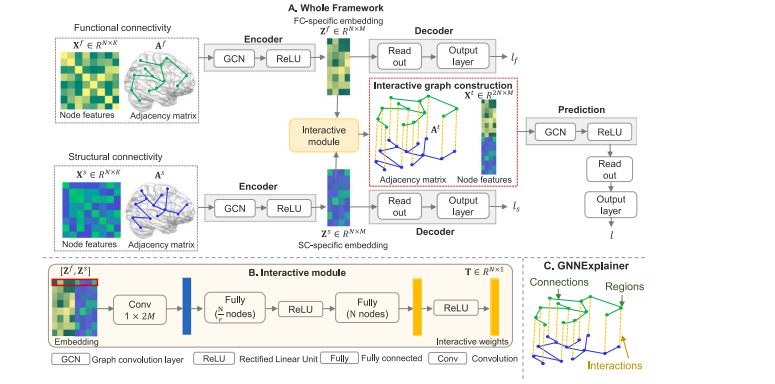
Fig. 1. Overall framework of MS-Inter-GCN. Given FC and SC, a graph convolutional encoder–decoder is employed to extract modality-specific task-relevant embeddings. Then,an interactive module is designed to learn about the interactions between the corresponding regions of SC and FC. By incorporating the interactive weights, a unified graphis constructed to produce the final regression or classification by incorporating the interactive weights. The GNNExplainer is applied to identify the most salient regions andconnections for each modality as well as structure–function interactions for tasks.
图1:特定模态及交互图卷积网络(MS-Inter-GCN)的总体框架。给定功能连接(FC)和结构连接(SC),使用图卷积编码器-解码器来提取特定模态的与任务相关的嵌入。然后,设计一个交互模块来学习结构连接(SC)和功能连接(FC)相应区域之间的相互作用。通过纳入交互权重,构建一个统一的图,以便结合交互权重来生成最终的回归结果或进行分类。应用图神经网络解释器(GNNExplainer)来识别每个模态中最显著的区域和连接,以及与任务相关的结构-功能相互作用。
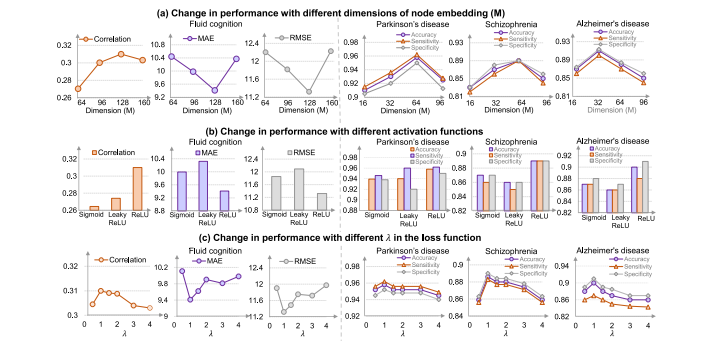
Fig. 2. The results of fluid cognition prediction, PD, SZ, and AD classification change with different (a) node embedding dimensions, (b) activation functions, and (c) weight inthe loss function.
图2:流体认知预测、帕金森病(PD)、精神分裂症(SZ)和阿尔茨海默病(AD)分类的结果会随着不同的(a)节点嵌入维度、(b)激活函数以及(c)损失函数中的权重而发生变化。
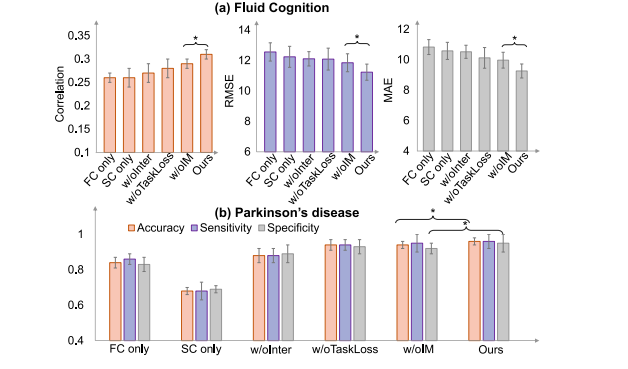
Fig. 3. Results of the ablation study of MS-Inter-GCN, comparing with six degenerated variants for (a) fluid cognition prediction and (b) PD classification, as two examples. Theterm ’*’ indicates the results of MS-Inter-GCN and the degenerated variant are significantly different, confirmed by the Student’s t-test (p < 0.05).
图3:特定模态及交互图卷积网络(MS-Inter-GCN)的消融研究结果,以流体认知预测(a)和帕金森病分类(b)这两个任务为例,与六个退化变体进行比较。术语“*”表示MS-Inter-GCN的结果与退化变体的结果存在显著差异,这一点已通过学生t检验确认(p < 0.05)。
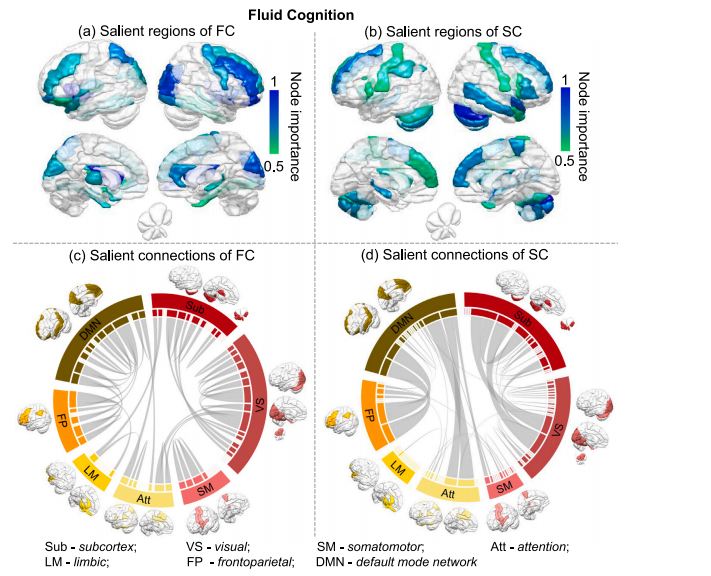
Fig. 4. Interpretation results of each modality from MS-Inter-GCN identified by GNNExplainer for fluid cognition. Top row: Visualization of node importance of ROIs representinghigh contributions to the fluid cognition prediction for (a) FC and (b) SC. Bottom row: Visualization of the most important 2% connections related to fluid cognition predictionfor (c) FC and (d) SC. The width of the curves represents the importance of the edges, with wider curves indicating higher importance. Brain surfaces in (c) and (d) display theparcellation of seven subnetworks.
图4:由图神经网络解释器(GNNExplainer)确定的特定模态及交互图卷积网络(MS-Inter-GCN)中每个模态的解释结果,针对流体认知。 顶行:对流体认知预测有高贡献的感兴趣区域(ROI)的节点重要性可视化,分别针对(a)功能连接(FC)和(b)结构连接(SC)。 底行:与流体认知预测相关的最重要的2%连接的可视化,分别针对(c)功能连接(FC)和(d)结构连接(SC)。曲线的宽度表示边的重要性,曲线越宽表明重要性越高。(c)和(d)中的脑表面展示了七个子网络的分区情况。
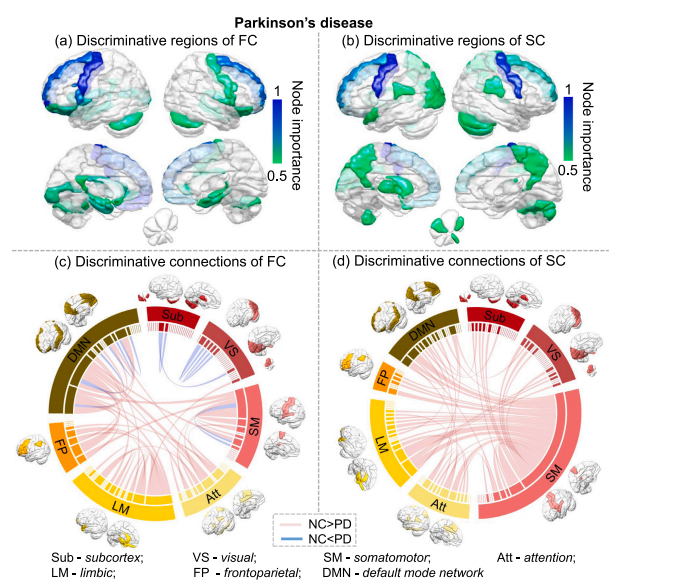
Fig. 5. Interpretation results of each modality from MS-Inter-GCN identified by GNNExplainer for PD classification. Top row: Visualization of node importance of ROIs representinga high contribution to the PD classification for (a) FC and (b) SC. Bottom row: Visualization of the most important 2% connections related to PD classification for (c) FC and (d)SC. The width of the curves represents the importance of the edges, with wider curves indicating higher importance. The pink curves indicate the functional connectivity of thenormal control group is higher than that of the patient group, while the blue curves indicate the functional connectivity of the normal control group is lower than that of thepatient group. Brain surfaces in (c) and (d) display the parcellation of seven subnetworks.
图5:由图神经网络解释器(GNNExplainer)确定的特定模态及交互图卷积网络(MS-Inter-GCN)中每个模态针对帕金森病分类的解释结果。顶行:对帕金森病分类有高贡献的感兴趣区域(ROI)的节点重要性可视化,分别针对(a)功能连接(FC)和(b)结构连接(SC)。底行:与帕金森病分类相关的最重要的2%连接的可视化,分别针对(c)功能连接(FC)和(d)结构连接(SC)。曲线的宽度表示边的重要性,曲线越宽表明重要性越高。粉色曲线表示正常对照组的功能连接高于患者组,而蓝色曲线表示正常对照组的功能连接低于患者组。(c)和(d)中的脑表面展示了七个子网络的分区情况。
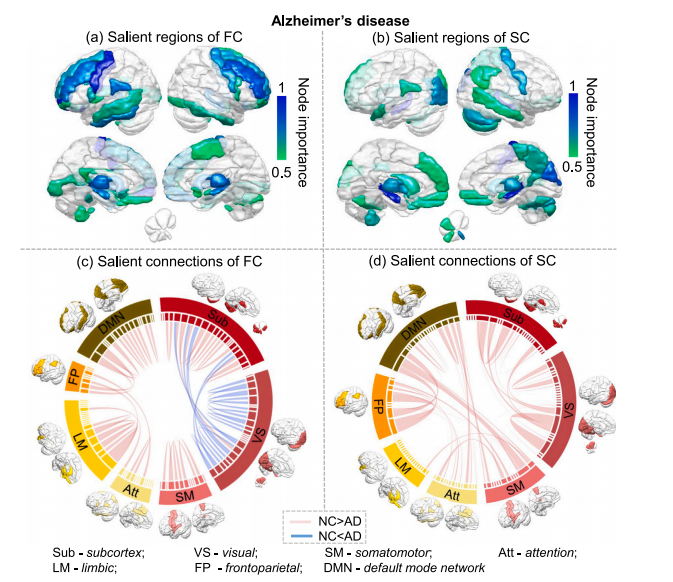
Fig. 6. Interpretation results of each modality from MS-Inter-GCN identified by GNNExplainer for AD classification. Top row: Visualization of node importance of ROIs representinga high contribution to the AD classification for (a) FC and (b) SC. Bottom row: Visualization of the most important 2% connections related to AD classification for (c) FC and (d)SC. The width of the curves represents the importance of the edges, with wider curves indicating higher importance. The pink curves indicate the functional connectivity of thenormal control group is higher than that of the patient group, while the blue curves indicate the functional connectivity of the normal control group is lower than that of thepatient group. Brain surfaces in (c) and (d) display the parcellation of seven subnetworks.
图6:由图神经网络解释器(GNNExplainer)确定的特定模态及交互图卷积网络(MS-Inter-GCN)中每个模态针对阿尔茨海默病分类的解释结果。顶行:对阿尔茨海默病分类有高贡献的感兴趣区域(ROI)的节点重要性可视化,分别针对(a)功能连接(FC)和(b)结构连接(SC)。底行:与阿尔茨海默病分类相关的最重要的2%连接的可视化,分别针对(c)功能连接(FC)和(d)结构连接(SC)。曲线的宽度表示边的重要性,曲线越宽表明重要性越高。粉色曲线表示正常对照组的功能连接高于患者组,而蓝色曲线表示正常对照组的功能连接低于患者组。(c)和(d)中的脑表面展示了七个子网络的分区情况。
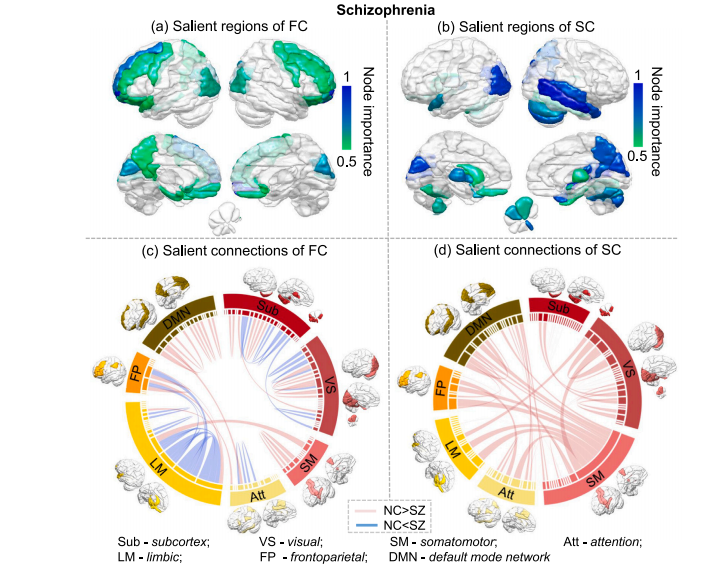
Fig. 7. Interpretation results of each modality from MS-Inter-GCN identified by GNNExplainer for SZ classification. Top row: Visualization of node importance of ROIs representinga high contribution to the SZ classification for (a) FC and (b) SC. Bottom row: Visualization of the most important 2% connections related to SZ classification for (c) FC and (d)SC. The width of the curves represents the importance of the edges, with wider curves indicating higher importance. The pink curves indicate the functional connectivity of thenormal control group is higher than that of the patient group, while the blue curves indicate the functional connectivity of the normal control group is lower than that of thepatient group. Brain surfaces in (c) and (d) display the parcellation of seven subnetworks.
图7:由图神经网络解释器(GNNExplainer)确定的特定模态及交互图卷积网络(MS-Inter-GCN)中每个模态针对精神分裂症(SZ)分类的解释结果。顶行:对精神分裂症分类有高贡献的感兴趣区域(ROI)的节点重要性可视化,分别针对(a)功能连接(FC)和(b)结构连接(SC)。底行:与精神分裂症分类相关的最重要的2%连接的可视化,分别针对(c)功能连接(FC)和(d)结构连接(SC)。曲线的宽度表示边的重要性,曲线越宽表明重要性越高。粉色曲线表示正常对照组的功能连接高于患者组,而蓝色曲线表示正常对照组的功能连接低于患者组。(c)和(d)中的脑表面展示了七个子网络的分区情况。
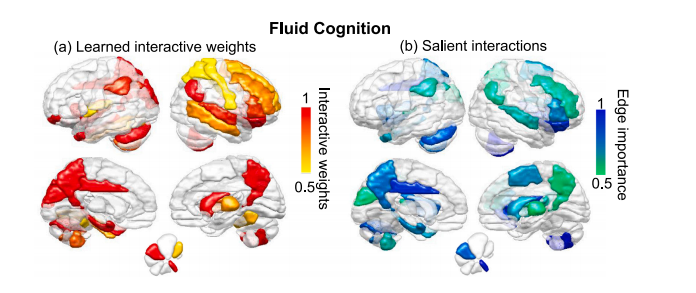
Fig. 8. Interpretation results of structure–function biomarkers from MS-Inter-GCN for fluid cognition. Visualization of (a) the interactive weights and (b) the edge importance ofinteractions identified by GNNExplainer.
图8:特定模态及交互图卷积网络(MS-Inter-GCN)针对流体认知的结构-功能生物标志物的解释结果。(a)交互权重的可视化,以及(b)由图神经网络解释器(GNNExplainer)确定的交互边重要性的可视化。
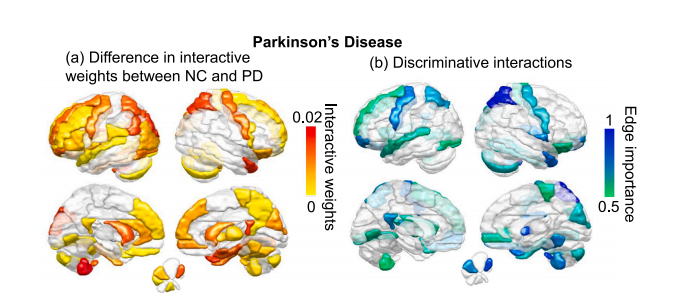
Fig. 9. Interpretation results of structure–function biomarkers from MS-Inter-GCN for Parkinson’s disease. Visualization of (a) the difference between interactive weights of normalcontrols (NC) and patients with PD and (b) the edge importance of interactions identified by GNNExplainer
图9:特定模态及交互图卷积网络(MS-Inter-GCN)针对帕金森病的结构-功能生物标志物的解释结果。(a)正常对照组(NC)和帕金森病患者的交互权重差异的可视化,以及(b)由图神经网络解释器(GNNExplainer)确定的交互边重要性的可视化。
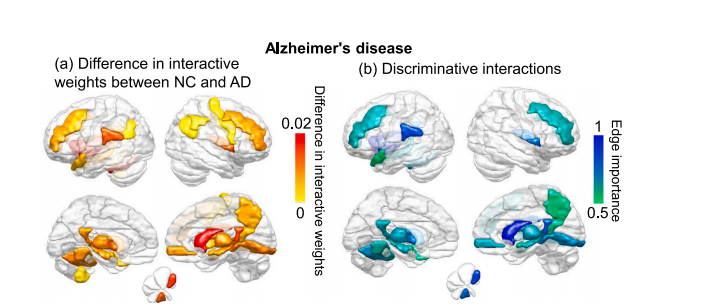
Fig. 10. Interpretation results of structure–function biomarkers from MS-Inter-GCN for Alzheimer’s disease. Visualization of (a) the difference between interactive weights of normalcontrols (NC) and patients with AD and (b) the edge importance of interactions identified by GNNExplainer
图10:特定模态及交互图卷积网络(MS-Inter-GCN)针对阿尔茨海默病的结构-功能生物标志物的解释结果。(a)正常对照组(NC)和阿尔茨海默病患者的交互权重差异的可视化,以及(b)由图神经网络解释器(GNNExplainer)确定的交互边重要性的可视化。
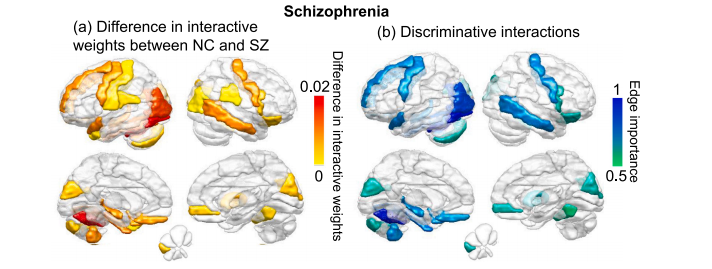
Fig. 11. Interpretation results of structure–function biomarkers from MS-Inter-GCN for schizophrenia. Visualization of (a) the difference between interactive weights of normalcontrols (NC) and patients with SZ and (b) the edge importance of interactions identified by GNNExplainer
图11:特定模态及交互图卷积网络(MS-Inter-GCN)针对精神分裂症的结构-功能生物标志物的解释结果。(a)正常对照组(NC)和精神分裂症患者的交互权重差异的可视化,以及(b)由图神经网络解释器(GNNExplainer)确定的交互边重要性的可视化。
Table
表
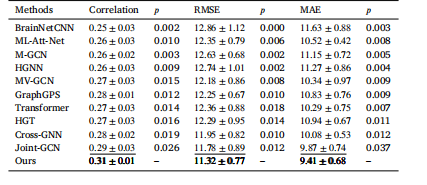
Table 1Comparison results of existing methods on HCP for fluid cognition prediction based onFC and SC.
表1 基于功能连接(FC)和结构连接(SC)的方法在人类连接组计划(HCP)数据集上用于流体认知预测的比较结果
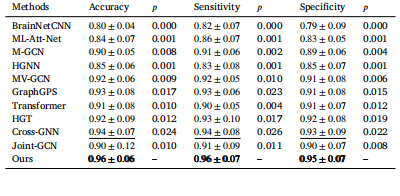
Table 2Comparison results of existing methods on PPMI for Parkinson’s disease classificationbased on FC and SC.
表2 基于功能连接(FC)和结构连接(SC)的现有方法在帕金森病进展标志物倡议(PPMI)数据集上进行帕金森病分类的比较结果。
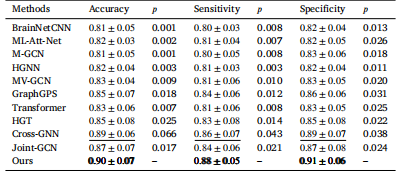
Table 3Comparison results of existing methods on ADNI for Alzheimer’s disease classificationbased on FC and SC.
表3 基于功能连接(FC)和结构连接(SC)的现有方法在阿尔茨海默病神经影像学倡议(ADNI)数据集上进行阿尔茨海默病分类的比较结果。
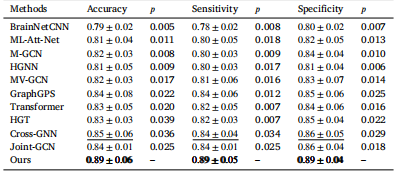
Table 4Comparison results of existing methods on COBRE for schizophrenia classification basedon FC and SC.
表4 基于功能连接(FC)和结构连接(SC)的现有方法在生物医学研究卓越中心(COBRE)数据集上进行精神分裂症分类的比较结果。
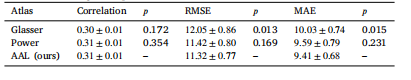
Table 5Results of fluid cognition prediction on HCP dataset with differen brain atlases.
表5:使用不同脑图谱在人类连接组计划(HCP)数据集上进行流体认知预测的结果
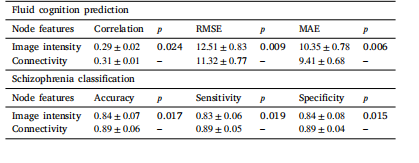
Table 6Results of fluid cognition prediction on the HCP dataset and schizophrenia classificationon the COBRE dataset using DTI/fMRI image intensity and connectivity profile as nodefeatures.
表6 使用弥散张量成像(DTI)/功能磁共振成像(fMRI)图像强度和连接概况作为节点特征,在人类连接组计划(HCP)数据集上进行流体认知预测,以及在生物医学研究卓越中心(COBRE)数据集上进行精神分裂症分类的结果。
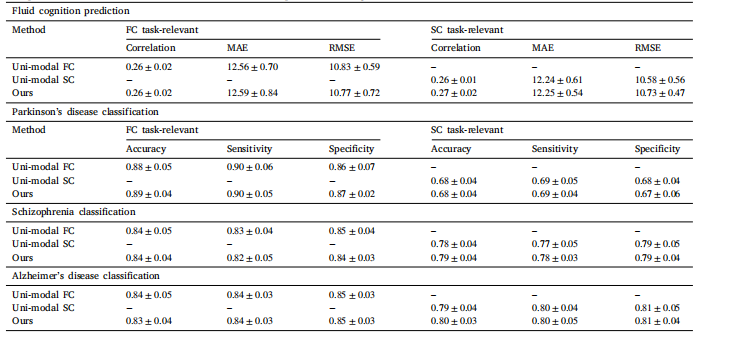
Table 7The performance of our FC and SC task-relevant models compared with a single GCN trained on either the uni-modal FC or SC for all tasks.
表7 我们的功能连接(FC)和结构连接(SC)任务相关模型与仅在单模态功能连接(FC)或结构连接(SC)上训练的单个图卷积网络(GCN)在所有任务上的性能比较。
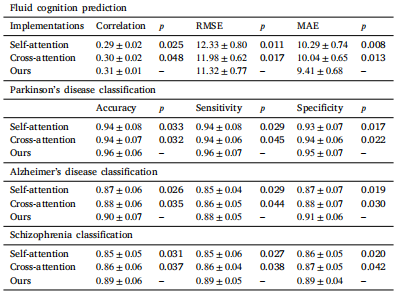
Table 8Comparison of our interactive module with other attention-based implementations.
表8 我们的交互模块与其他基于注意力机制的实现方式的比较。