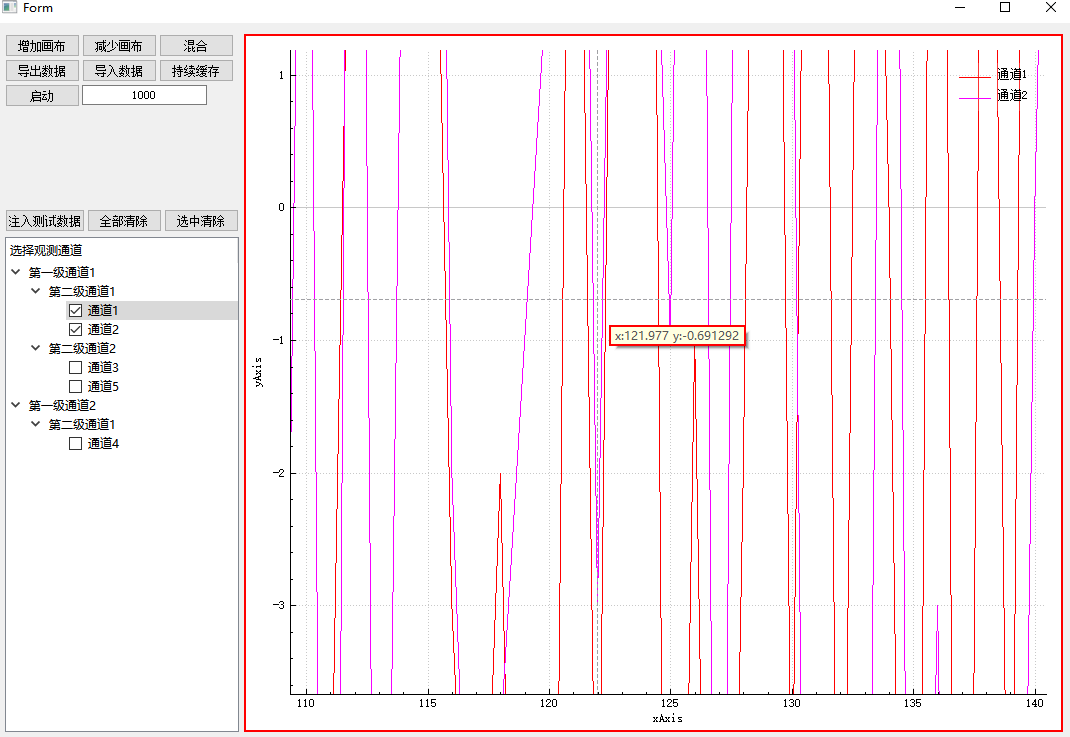
一、效果
二、代码
#include "obsersingle.h"
#include "ui_obsersingle.h"
#pragma execution_character_set("utf-8")
void ObserSingle::RescaleActionFun::fun(ObserSingle *form)
{form->customPlot->rescaleAxes(true);form->customPlot->replot(QCustomPlot::rpQueuedReplot);
}
void ObserSingle::CursorActionFun::fun(ObserSingle *form)
{if(form->cursorShow){form->lineY->point1->setCoords(0, 0);form->lineY->point2->setCoords(0, 0);form->lineX->point1->setCoords(0, 0);form->lineX->point2->setCoords(0, 0);form->cursorShow = false;}else{form->cursorShow = true;}form->customPlot->replot(QCustomPlot::rpQueuedReplot);
}
ObserSingle::ObserSingle(QWidget *parent) :QWidget(parent),ui(new Ui::ObserSingle), clickMenu(new QMenu), lineY(nullptr), lineX(nullptr), cursorShow(false), midButtonPress(false), customPlot(new QCustomPlot)
{ui->setupUi(this);QGridLayout *layout = new QGridLayout();layout->setContentsMargins(2, 2, 2, 2);layout->addWidget(customPlot);ui->plotWindow->setLayout(layout);customPlot->xAxis->setRange(1, 1, Qt::AlignRight); customPlot->xAxis->ticker()->setTickCount(8); customPlot->xAxis->setLabel(tr("xAxis")); customPlot->yAxis->setRange(2, 2, Qt::AlignRight);customPlot->yAxis->ticker()->setTickCount(5);customPlot->yAxis->setLabel(tr("yAxis"));customPlot->legend->setVisible(true); customPlot->legend->setBrush(QColor(255, 255, 255, 50)); customPlot->legend->setBorderPen(Qt::NoPen); customPlot->legend->setWrap(4); customPlot->legend->setFillOrder(QCPLayoutGrid::foRowsFirst);
customPlot->plotLayout()->setRowStretchFactor(0, 0.001); customPlot->setInteractions(QCP::iRangeDrag|QCP::iRangeZoom| QCP::iSelectAxes | QCP::iSelectLegend | QCP::iSelectPlottables);
customPlot->legend->setSelectableParts(QCPLegend::spItems);QObject::connect(customPlot, SIGNAL(selectionChangedByUser()), this, SLOT(selectionChanged()));clickMenuAddAction(tr("适应窗口大小"), ":/reference/image/plot.png", new RescaleActionFun);clickMenuAddAction(tr("十字游标"), ":/reference/image/plot.png", new CursorActionFun);QObject::connect(customPlot, SIGNAL(mousePress(QMouseEvent*)), this, SLOT(onMousePress(QMouseEvent *)));lineY = new QCPItemStraightLine(customPlot);lineY->setLayer("overlay");lineY->setPen(QPen(Qt::gray, 1, Qt::DashLine));lineY->setClipToAxisRect(true);lineY->point1->setCoords(0, 0);lineY->point2->setCoords(0, 0);lineX = new QCPItemStraightLine(customPlot);lineX->setLayer("overlay");lineX->setPen(QPen(Qt::gray, 1, Qt::DashLine));lineX->setClipToAxisRect(true);lineX->point1->setCoords(0, 0);lineX->point2->setCoords(0, 0);QObject::connect(customPlot, SIGNAL(mouseMove(QMouseEvent*)), this, SLOT(onMouseMove(QMouseEvent *)));QObject::connect(customPlot, SIGNAL(mouseRelease(QMouseEvent*)), this, SLOT(onMouseRelease(QMouseEvent *)));customPlot->rescaleAxes(true);customPlot->replot(QCustomPlot::rpQueuedReplot);
}ObserSingle::~ObserSingle()
{ui->plotWindow->layout()->deleteLater();QList<QString> keyList = actionFunMap.keys();for(int i=0; i<keyList.size(); i++){if(actionFunMap[keyList[i]]){delete actionFunMap[keyList[i]];}}QList<QAction *> actionList = actionMap.keys();for(int i=0; i<actionList.size(); i++){if(actionList.at(i)){delete actionList.at(i);}}if(clickMenu){clickMenu->deleteLater();}if(customPlot){customPlot->deleteLater();}delete ui;
}
void ObserSingle::onMouseMove(QMouseEvent *event)
{if(midButtonPress){QPoint pos = QCursor::pos();int xLen = pos.x() - posPress.x();int yLen = pos.y() - posPress.y();if(qAbs(xLen) - qAbs(yLen) > 0){if(xLen > 0){double xSize = customPlot->xAxis->range().upper - customPlot->xAxis->range().lower;customPlot->xAxis->setRangeLower(customPlot->xAxis->range().lower + xSize/20);customPlot->xAxis->setRangeUpper(customPlot->xAxis->range().upper - xSize/20);}else{double xSize = customPlot->xAxis->range().upper - customPlot->xAxis->range().lower;customPlot->xAxis->setRangeLower(customPlot->xAxis->range().lower - xSize/20);customPlot->xAxis->setRangeUpper(customPlot->xAxis->range().upper + xSize/20);}}else{if(yLen > 0){double ySize = customPlot->yAxis->range().upper - customPlot->yAxis->range().lower;customPlot->yAxis->setRangeLower(customPlot->yAxis->range().lower - ySize/20);customPlot->yAxis->setRangeUpper(customPlot->yAxis->range().upper + ySize/20);}else{double ySize = customPlot->yAxis->range().upper - customPlot->yAxis->range().lower;customPlot->yAxis->setRangeLower(customPlot->yAxis->range().lower + ySize/20);customPlot->yAxis->setRangeUpper(customPlot->yAxis->range().upper - ySize/20);}}posPress = pos;customPlot->replot(QCustomPlot::rpQueuedReplot);}else{int x_pos = event->pos().x();int y_pos = event->pos().y();float x_val = customPlot->xAxis->pixelToCoord(x_pos);float y_val = customPlot->yAxis->pixelToCoord(y_pos);if(cursorShow){lineY->point1->setCoords(x_val, customPlot->yAxis->range().lower);lineY->point2->setCoords(x_val, customPlot->yAxis->range().upper);lineX->point1->setCoords(customPlot->xAxis->range().lower, y_val);lineX->point2->setCoords(customPlot->xAxis->range().upper, y_val);customPlot->replot(QCustomPlot::rpQueuedReplot);}QToolTip::hideText();QToolTip::showText(event->globalPos(),QString("x:%1 y:%2").arg(x_val).arg(y_val),this, rect());}
}
void ObserSingle::selectionChanged()
{if (customPlot->xAxis->selectedParts().testFlag(QCPAxis::spAxis) || customPlot->xAxis->selectedParts().testFlag(QCPAxis::spTickLabels) ||customPlot->xAxis2->selectedParts().testFlag(QCPAxis::spAxis) || customPlot->xAxis2->selectedParts().testFlag(QCPAxis::spTickLabels)){customPlot->xAxis2->setSelectedParts(QCPAxis::spAxis|QCPAxis::spTickLabels);customPlot->xAxis->setSelectedParts(QCPAxis::spAxis|QCPAxis::spTickLabels);}if (customPlot->yAxis->selectedParts().testFlag(QCPAxis::spAxis) || customPlot->yAxis->selectedParts().testFlag(QCPAxis::spTickLabels) ||customPlot->yAxis2->selectedParts().testFlag(QCPAxis::spAxis) || customPlot->yAxis2->selectedParts().testFlag(QCPAxis::spTickLabels)){customPlot->yAxis2->setSelectedParts(QCPAxis::spAxis|QCPAxis::spTickLabels);customPlot->yAxis->setSelectedParts(QCPAxis::spAxis|QCPAxis::spTickLabels);}for (int i=0; i<customPlot->graphCount(); ++i){QCPGraph *graph = customPlot->graph(i);QCPPlottableLegendItem *item = customPlot->legend->itemWithPlottable(graph);if (item->selected() || graph->selected()){item->setSelected(true);graph->setSelection(QCPDataSelection(graph->data()->dataRange()));}}
}
void ObserSingle::onMousePress(QMouseEvent *event)
{if(event->button() == Qt::RightButton){clickMenu->exec(QCursor::pos());}else if(event->button() == Qt::MiddleButton){midButtonPress = true;posPress = QCursor::pos();}
}
void ObserSingle::onMouseRelease(QMouseEvent *event)
{if(event->button() == Qt::MiddleButton){midButtonPress = false;}
}
void ObserSingle::_on_action_create_triggered(void)
{QAction *action = static_cast<QAction *>(this->sender());if(actionMap.contains(action)){if(actionFunMap.contains(actionMap[action])){actionFunMap[actionMap[action]]->fun(this);}}
}
void ObserSingle::clickMenuAddAction(QString name, QString icon, MenuActionFun *fun)
{QAction *action = new QAction(QIcon(icon), name, this);actionMap.insert(action, name);QObject::connect(action, SIGNAL(triggered()), this, SLOT(_on_action_create_triggered()));clickMenu->addAction(action);actionFunMap.insert(name, fun);
}
void ObserSingle::drawCurve(const QString name, const QVector<double> x, const QVector<double> y, QPen pen)
{if(curveMap.contains(name)){curveMap[name]->setData(x, y, true);}else{QCPGraph *graph = customPlot->addGraph();graph->setAntialiased(false); graph->setAntialiasedFill(false);graph->setAntialiasedScatters(false);graph->setPen(pen);graph->setName(name);graph->setData(x, y, true);curveMap.insert(name, graph);}customPlot->replot(QCustomPlot::rpQueuedReplot);
}
void ObserSingle::clearCurve(const QString name)
{if(curveMap.contains(name)){QVector<double> x, y;
QCPGraph *graph;curveMap.remove(name);QList<QString> nameList = curveMap.keys();QList<QString> nameListSave;QList<QVector<double>> xList;QList<QVector<double>> yList;QList<QPen> penList;for(int i=0; i<nameList.size(); i++){graph = curveMap[nameList[i]];curveMap.remove(nameList[i]);x.clear();y.clear();for(int data_i=0; data_i<graph->data()->size(); data_i++){x.append(graph->data()->at(data_i)->key);y.append(graph->data()->at(data_i)->value);}QColor color = graph->pen().color();
nameListSave.append(nameList[i]);xList.append(x);yList.append(y);penList.append(QPen(color));}customPlot->clearGraphs();for(int i=0; i<nameListSave.size(); i++){drawCurve(nameListSave[i], xList[i], yList[i], penList[i]);}}customPlot->replot(QCustomPlot::rpQueuedReplot);
}
void ObserSingle::replot(void)
{customPlot->rescaleAxes(true);
}
void ObserSingle::setRunStatus(bool b)
{if(b){customPlot->setInteractions(QCP::iRangeDrag|QCP::iRangeZoom| QCP::iSelectAxes );for (int i=0; i<customPlot->graphCount(); ++i){QCPGraph *graph = customPlot->graph(i);QCPPlottableLegendItem *item = customPlot->legend->itemWithPlottable(graph);if (item->selected() || graph->selected()){item->setSelected(false);QCPDataSelection select;graph->setSelection(select);}}}else{customPlot->setInteractions(QCP::iRangeDrag|QCP::iRangeZoom| QCP::iSelectAxes | QCP::iSelectLegend | QCP::iSelectPlottables);}
}