Matlab作图之 subplot
1. subplot(m, n, p)
将当前图形'划分为m*n的网格,在 p 指定的位置创建坐标轴
matlab 按照行号对子图的位置进行编号
第一个子图是第一行第一列,第二个子图是第二行第二列.........
如果指定 p 位置存在坐标轴, 此命令会将已存在的坐标轴设为当前坐标轴
2. subplot(m, n, p, 'replace')
用新创建的坐标轴替换 p 位置处的坐标轴
3. subplot(m, n, p, 'align')
在 p 位置处创建新坐标轴,对齐图框
4. subplot(m, n, p, ax)
将现有坐标轴 ax 转换为同一图形中的子图
5. subplot('Position', pos)
在pos指定的自定义位置创建坐标轴,可定位没有贺网格位置对齐的子图。
指定的 pos 作为[left bottom width height] 形式的四元素矢量【左边距,下边距,宽,高】
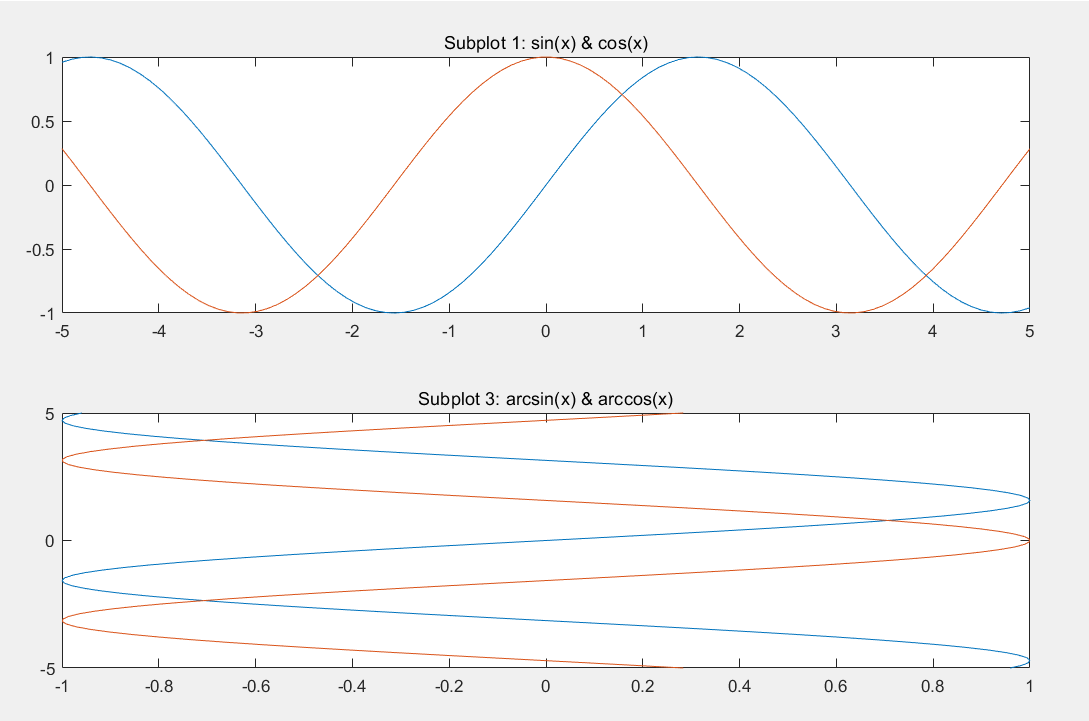
figure('Position',[20, 50, 1000 600])
subplot(2, 1, 1);       %第一个子图
x = linspace(-5, 5);
y1 = sin(x);
plot(x, y1)% subplot(2, 1, 2);    %第二个子图
hold on;
y2 = cos(x);
plot(x, y2)
title('Subplot 1: sin(x) & cos(x)')
(如果新坐标轴与现有坐标轴重叠,新坐标轴将替换现有的坐标轴)
【效果图】
6. subplot(___, Name, Value)
使用一个或多个 名称-值 键值对 参数,修改坐标轴属性
Axes属性,在所有其他输入参数后设置坐标轴属性
7. ax = subplot(___)
返回所创建的Aexs 对象,可以用 ax 修改坐标轴
8. subplot(ax)
将 ax 指定的坐标轴设为父图的当前坐标轴,
如果父图不是当前图形,该指令不会让父图变成当前图形
【例子】
1. 上部 + 下部 子图
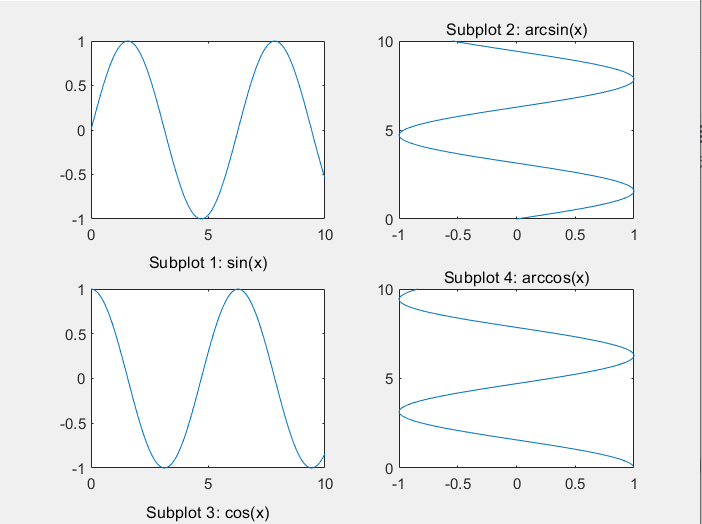
1. 作象限图
创建一个分为四个子图的图像,在每个子图上绘制一条正弦函数图像,并为每个子图指定标题
subplot(2, 2, 1);            %图1
x = linspace(0, 10);
y1 = sin(x);
plot(x, y1)
title('Subplot 1: sin(x)','Units','normalized','Position', [0.5, -0.3 ,0])
%% 标题在图片下方(距离左边0.5,距离图片下方-0.3)subplot(2, 2, 2);            %图2
plot(y1, x)
title('SUbplot 2: arcsin(x)')subplot(2, 2, 3);            %图3
y2 = cos(x);
plot(x, y2)
title('Subplot 3: cos(x)' ,'Units','normalized','Position', [0.5, -0.3 ,0])subplot(2, 2, 4);            %图4
plot(y2, x)
title('Subplot 4: arccos(x)')
效果图如下
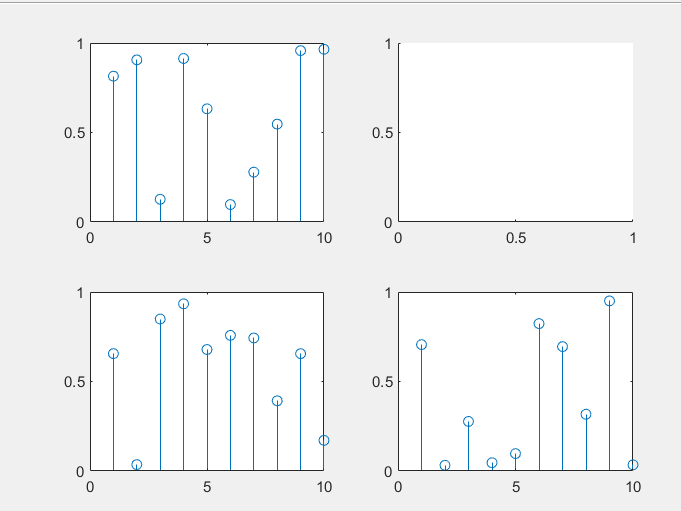
2. 将子图转换为空坐标轴
创建一个包含四个随机数据针状图的图形,将第二个子图替换为空坐标轴
for k = 1:4data = rand(1,10);subplot(2,2,k)stem(data)        %绘制离散数据的函数
endsubplot(2,2,2,'replace');
效果图如下
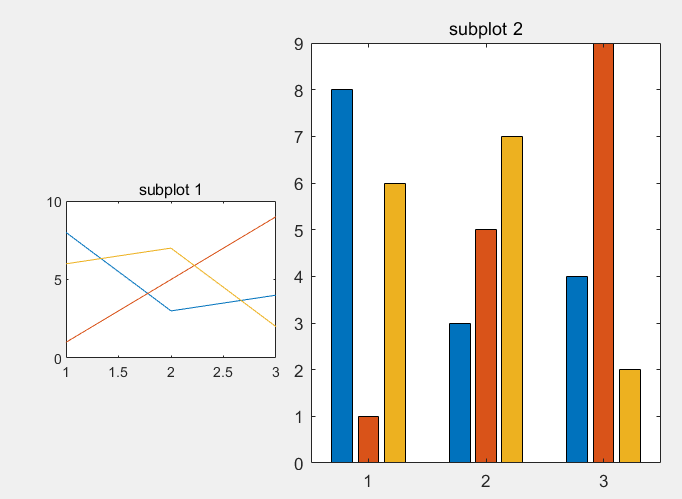
3. 自定义位置上的子图
创建包含两个未与网格位置对齐的子图的图形,为每个子图指定一个自定义位置
pos1 = [0.1 0.3 0.3 0.3]
subplot('Position',pos1)
y = magic(3)              %magic()函数用来产生魔方矩阵%每行、每列 以及对角线的数之和相等,为(1+2+...+n^2)/n
plot(y)
title('subplot 1')pos2 = [0.45 0.1 0.5 0.8];
subplot('Position', pos2)
bar(y)                      %绘制条形图
title('subplot 2')
效果图如下
参考博文:subplot在matlab中的用法-平平无奇的小女子~CSDN博客