22、能源监控与优化 - 数据中心模拟 - /能源管理组件/data-center-energy-monitoring
76个工业组件库示例汇总
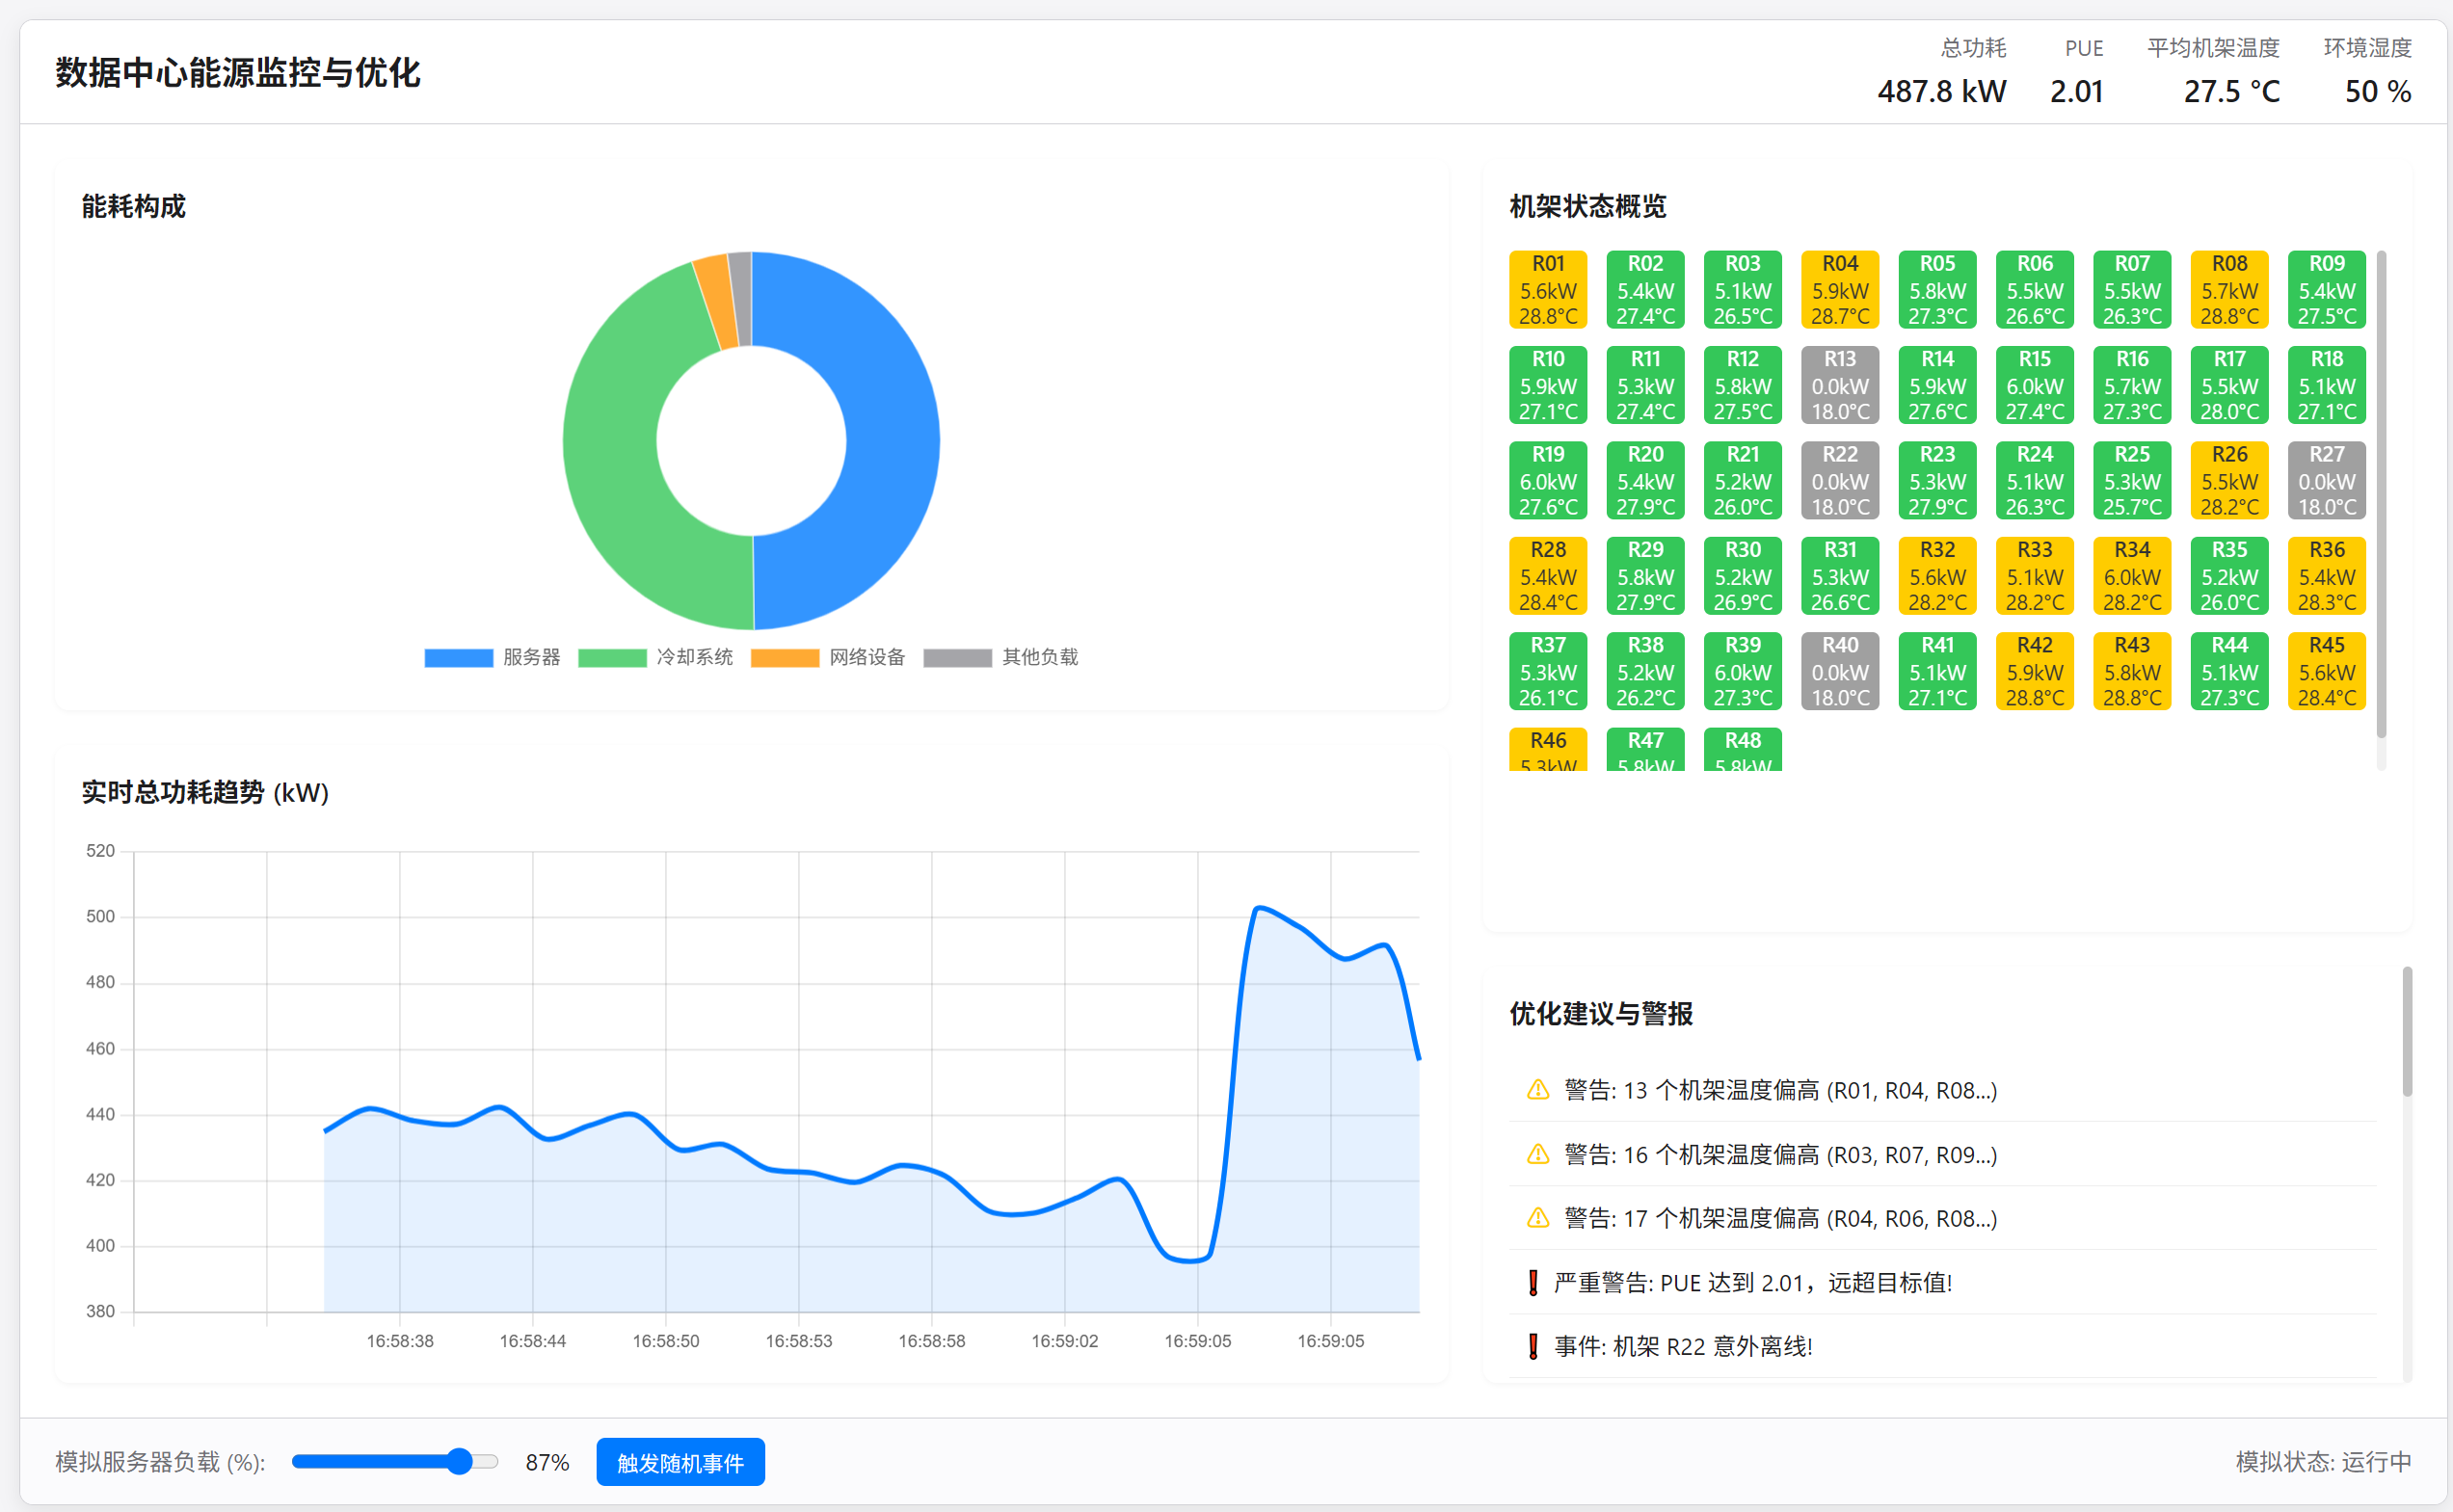
能源监控与优化组件 - 数据中心模拟
1. 组件概述
本组件旨在模拟一个典型数据中心的能源消耗情况,并提供实时的监控数据和基本的优化建议/警报功能。用户可以通过界面直观地了解数据中心总体功耗、PUE (电源使用效率)、各部分能耗构成、机架温度状态等关键指标,并观察其动态变化。
2. 主要功能
- 实时指标概览: 顶部显示数据中心总功耗 (kW)、PUE、平均机架温度 (°C) 和环境湿度 (%)。
- 能耗构成可视化: 使用甜甜圈图展示服务器、冷却系统、网络设备及其他负载的功耗占比。
- 功耗趋势可视化: 使用折线图展示数据中心总功耗随时间变化的趋势。
- 机架状态监控: 以网格形式展示各个服务器机架的实时状态,通过颜色区分正常 (绿)、警告 (黄)、危险 (红) 或离线 (灰) 状态,并显示每个机架的功耗和温度。
- 优化建议与警报: 根据预设阈值(如 PUE 过高、机架温度异常)自动生成警报或节能建议。
- 模拟交互: 用户可以通过滑块调整模拟的服务器平均负载,观察不同负载下的能耗变化;也可以手动触发随机事件(如温度飙升、负载骤增、机架离线)来模拟现实中的突发情况。
- 响应式布局: 界面宽度自适应浏览器大小,在不同设备上都能提供良好的浏览体验,同时避免内容区域过高。
3. 技术栈
- HTML5
- CSS3 (Flexbox, Grid, CSS Variables, Media Queries)
- JavaScript (ES6+)
- Chart.js (用于绘制图表)
4. 运行与使用
- 将
data-center-energy-monitoring文件夹放置在能源管理组件目录下。 - 在支持 HTML5 和 JavaScript 的浏览器中打开
index.html文件。 - 界面加载后,模拟将自动开始运行。
- 观察顶部指标、图表和机架状态的变化。
- 在底部的控制栏中:
- 拖动"模拟服务器负载"滑块来改变数据中心的 IT 负载,观察各项指标如何响应。
- 点击"触发随机事件"按钮来模拟突发状况,观察系统警报和状态变化。
- 点击机架状态网格中的任意一个机架,可以在"优化建议与警报"区域看到该机架的详细信息(当前实现为简单的日志输出)。
5. 模拟逻辑说明
- 服务器功耗: 基于设定的基础功耗和最大功耗,根据用户调整的"服务器负载"百分比进行计算,并加入小幅随机波动。
- 冷却功耗: 简单模型,假设冷却功耗是 IT 功耗(服务器功耗)的一个比例,且该比例会随着 IT 功耗的增加而增加(模拟更高负载需要更强制冷)。
- 总功耗: 服务器功耗 + 冷却功耗 + 固定的网络功耗 + 固定的其他负载功耗。
- PUE: 总功耗 / IT 功耗。越接近 1 越好。
- 机架温度: 简单模型,基于机架的服务器功耗计算一个基础温度,并加入随机波动。根据温度与设定的最佳范围比较,确定"正常"、“警告”、"危险"状态。
- 平均温度/湿度: 计算所有活动机架的平均温度;湿度在设定范围内随机小幅波动。
- 警报/建议: 基于 PUE 值、机架温度状态和当前负载情况生成简单的文本提示。
6. 注意事项
- 这是一个概念性模拟,其能耗和温度模型经过高度简化,不代表真实数据中心的精确物理过程。
- 目的是为了演示能源监控仪表盘的界面设计和基本的数据联动效果。
- 所有数据均为程序生成,没有连接到任何真实的数据源。
效果展示
源码
index.html
<!DOCTYPE html>
<html lang="zh-CN">
<head><meta charset="UTF-8"><meta name="viewport" content="width=device-width, initial-scale=1.0"><title>能源监控与优化 - 数据中心</title><link rel="stylesheet" href="styles.css"><!-- Consider using a charting library like Chart.js --><script src="https://cdn.jsdelivr.net/npm/chart.js"></script>
</head>
<body><div class="container"><header class="overview-bar"><h1>数据中心能源监控与优化</h1><div class="metrics"><div class="metric-item"><span class="label">总功耗</span><span class="value" id="totalPower">-- kW</span></div><div class="metric-item"><span class="label">PUE</span><span class="value" id="pueValue">--</span></div><div class="metric-item"><span class="label">平均机架温度</span><span class="value" id="avgTemp">-- °C</span></div><div class="metric-item"><span class="label">环境湿度</span><span class="value" id="humidity">-- %</span></div></div></header><main class="main-content"><section class="charts-section"><div class="chart-container power-breakdown-container"><h2>能耗构成</h2><canvas id="powerBreakdownChart"></canvas></div><div class="chart-container power-trend-container"><h2>实时总功耗趋势 (kW)</h2><canvas id="powerTrendChart"></canvas></div></section><section class="status-and-optimization"><div class="rack-status-container"><h2>机架状态概览</h2><div class="rack-grid" id="rackGrid"><!-- Rack status indicators will be generated by JS --><p>正在加载机架数据...</p></div></div><div class="optimization-alerts-container"><h2>优化建议与警报</h2><ul id="alertList"><li>系统初始化完成,等待数据...</li><!-- Alerts and suggestions will be added by JS --></ul></div></section></main><footer class="control-bar"><div class="simulation-controls"><label for="simLoadSlider">模拟服务器负载 (%):</label><input type="range" id="simLoadSlider" min="10" max="100" value="60"><span id="simLoadValue">60%</span><button id="triggerEventBtn">触发随机事件</button></div><div class="simulation-status"><span>模拟状态: <span id="simStatus">运行中</span></span></div></footer></div><script src="script.js"></script>
</body>
</html>
styles.css
:root {--bg-color: #f5f5f7;--panel-bg-color: #ffffff;--border-color: #d2d2d7;--text-color-primary: #1d1d1f;--text-color-secondary: #6e6e73;--accent-blue: #007aff;--accent-green: #34c759;--accent-yellow: #ffcc00;--accent-red: #ff3b30;--font-family: -apple-system, BlinkMacSystemFont, "Segoe UI", Roboto, Helvetica, Arial, sans-serif;--border-radius: 8px;--container-padding: 20px;--panel-padding: 15px;--header-height: 60px;--footer-height: 50px;
}* {box-sizing: border-box;margin: 0;padding: 0;
}body {font-family: var(--font-family);background-color: var(--bg-color);color: var(--text-color-primary);line-height: 1.5;display: flex;justify-content: center;align-items: flex-start; /* Align to top */min-height: 100vh;padding: 20px; /* Padding around the whole component */
}.container {width: 100%;max-width: 1400px; /* Limit max width */background-color: var(--panel-bg-color);border-radius: var(--border-radius);border: 1px solid var(--border-color);box-shadow: 0 4px 12px rgba(0, 0, 0, 0.08);overflow: hidden;display: flex;flex-direction: column;/* Control height implicitly via content, avoid fixed height */
}/* Header / Overview Bar */
.overview-bar {display: flex;justify-content: space-between;align-items: center;padding: 0 var(--container-padding);height: var(--header-height);border-bottom: 1px solid var(--border-color);background-color: #ffffff; /* Slightly different background? */
}.overview-bar h1 {font-size: 1.2em;font-weight: 600;color: var(--text-color-primary);
}.metrics {display: flex;gap: 25px;
}.metric-item {display: flex;flex-direction: column;align-items: flex-end;
}.metric-item .label {font-size: 0.8em;color: var(--text-color-secondary);margin-bottom: 2px;
}.metric-item .value {font-size: 1.1em;font-weight: 600;color: var(--text-color-primary);
}/* Main Content Area */
.main-content {display: flex;flex: 1; /* Allow main content to grow */padding: var(--container-padding);gap: var(--container-padding);min-height: 400px; /* Ensure minimum height for content */
}.charts-section {flex: 3; /* Charts take more space */display: flex;flex-direction: column;gap: var(--container-padding);
}.status-and-optimization {flex: 2; /* Status/Alerts take less space */display: flex;flex-direction: column;gap: var(--container-padding);
}.chart-container,
.rack-status-container,
.optimization-alerts-container {background-color: var(--panel-bg-color);/* border: 1px solid var(--border-color); Maybe remove internal borders */border-radius: var(--border-radius);padding: var(--panel-padding);box-shadow: 0 1px 3px rgba(0,0,0,0.04);
}.chart-container h2,
.rack-status-container h2,
.optimization-alerts-container h2 {font-size: 0.95em;font-weight: 600;margin-bottom: 15px;color: var(--text-color-primary);
}/* Specific section sizing */
.power-breakdown-container {flex-basis: 40%; /* Adjust relative heights */
}
.power-trend-container {flex-basis: 60%;
}
.rack-status-container {flex-basis: 65%;
}
.optimization-alerts-container {flex-basis: 35%;max-height: 250px; /* Limit height of alerts */overflow-y: auto;
}/* Chart Canvas Styling */
.chart-container canvas {max-width: 100%;max-height: 250px; /* Limit chart height */
}
.power-trend-container canvas {max-height: 300px; /* Allow trend chart to be slightly taller */
}/* Rack Grid */
.rack-grid {display: grid;grid-template-columns: repeat(auto-fill, minmax(45px, 1fr));gap: 10px;max-height: 300px; /* Limit grid height */overflow-y: auto;padding-right: 5px; /* Space for scrollbar */
}.rack-indicator {width: 45px;height: 45px;border-radius: 4px;display: flex;flex-direction: column; /* Stack text vertically */justify-content: center;align-items: center;font-size: 0.7em;color: #fff;text-align: center;cursor: pointer;transition: transform 0.2s ease, box-shadow 0.2s ease;line-height: 1.2;padding: 2px;position: relative;overflow: hidden; /* Hide overflow for effects */
}.rack-indicator:hover {transform: scale(1.05);box-shadow: 0 2px 8px rgba(0, 0, 0, 0.15);z-index: 10;
}.rack-id {font-weight: 600;display: block;margin-bottom: 2px;
}
.rack-power, .rack-temp {font-size: 0.9em;
}/* Rack status colors */
.rack-status-normal {background-color: var(--accent-green);
}
.rack-status-warning {background-color: var(--accent-yellow);color: #333;
}
.rack-status-critical {background-color: var(--accent-red);
}
.rack-status-offline {background-color: #a0a0a0;
}/* Optimization/Alerts List */
#alertList {list-style: none;padding: 0;font-size: 0.85em;
}#alertList li {padding: 8px 10px;border-bottom: 1px solid #eee;display: flex;align-items: center;gap: 8px;
}#alertList li:last-child {border-bottom: none;
}/* Alert types styling */
.alert-info::before {content: "\2139"; /* Info symbol */color: var(--accent-blue);font-weight: bold;
}
.alert-warning::before {content: "\26A0"; /* Warning symbol */color: var(--accent-yellow);font-weight: bold;
}
.alert-critical::before {content: "\2757"; /* Exclamation mark */color: var(--accent-red);font-weight: bold;
}
.alert-suggestion::before {content: "\1F4A1"; /* Light bulb */color: var(--accent-green);
}/* Footer / Control Bar */
.control-bar {display: flex;justify-content: space-between;align-items: center;padding: 0 var(--container-padding);height: var(--footer-height);border-top: 1px solid var(--border-color);background-color: #fbfbfd; /* Slightly different footer bg */font-size: 0.85em;
}.simulation-controls {display: flex;align-items: center;gap: 15px;
}.simulation-controls label {color: var(--text-color-secondary);
}.simulation-controls input[type="range"] {width: 120px;cursor: pointer;
}.simulation-controls button {padding: 5px 12px;background-color: var(--accent-blue);color: white;border: none;border-radius: 5px;cursor: pointer;font-size: 0.9em;transition: background-color 0.2s ease;
}.simulation-controls button:hover {background-color: #0056b3;
}.simulation-status span {color: var(--text-color-secondary);
}/* Scrollbar Styling (optional, Webkit) */
::-webkit-scrollbar {width: 6px;height: 6px;
}
::-webkit-scrollbar-track {background: #f1f1f1;border-radius: 3px;
}
::-webkit-scrollbar-thumb {background: #c1c1c1;border-radius: 3px;
}
::-webkit-scrollbar-thumb:hover {background: #a8a8a8;
}/* Responsive Adjustments */
@media (max-width: 1200px) {.metrics {gap: 15px;}.metric-item .value {font-size: 1em;}.rack-grid {grid-template-columns: repeat(auto-fill, minmax(40px, 1fr));gap: 8px;}.rack-indicator {width: 40px;height: 40px;font-size: 0.65em;}
}@media (max-width: 992px) {.main-content {flex-direction: column;min-height: auto; /* Allow height to adjust */}.charts-section,.status-and-optimization {flex: none; /* Reset flex grow */width: 100%;}.rack-grid {max-height: 250px;}.optimization-alerts-container {max-height: 200px;}
}@media (max-width: 768px) {body {padding: 10px;}.container {border-radius: 0; /* Full width on small screens */border-left: none;border-right: none;}.overview-bar {flex-direction: column;height: auto;padding: 10px var(--container-padding);align-items: flex-start;}.overview-bar h1 {margin-bottom: 10px;}.metrics {width: 100%;justify-content: space-between;gap: 10px;}.metric-item {align-items: center; /* Center metrics on mobile */}.main-content {padding: var(--panel-padding);}.charts-section, .status-and-optimization {gap: var(--panel-padding);}.control-bar {flex-direction: column;height: auto;padding: 10px var(--container-padding);gap: 10px;}.simulation-controls {flex-wrap: wrap;justify-content: center;gap: 10px;}
}@media (max-width: 480px) {.metrics {flex-wrap: wrap;justify-content: center;}.metric-item {flex-basis: 45%; /* Two metrics per row */align-items: center;margin-bottom: 5px;}.rack-grid {grid-template-columns: repeat(auto-fill, minmax(35px, 1fr));gap: 5px;max-height: 200px;}.rack-indicator {width: 35px;height: 35px;font-size: 0.6em;}
}
script.js
document.addEventListener('DOMContentLoaded', () => {// --- DOM Elements ---const totalPowerSpan = document.getElementById('totalPower');const pueValueSpan = document.getElementById('pueValue');const avgTempSpan = document.getElementById('avgTemp');const humiditySpan = document.getElementById('humidity');const powerBreakdownCanvas = document.getElementById('powerBreakdownChart');const powerTrendCanvas = document.getElementById('powerTrendChart');const rackGridDiv = document.getElementById('rackGrid');const alertListUl = document.getElementById('alertList');const simLoadSlider = document.getElementById('simLoadSlider');const simLoadValueSpan = document.getElementById('simLoadValue');const triggerEventBtn = document.getElementById('triggerEventBtn');const simStatusSpan = document.getElementById('simStatus');// --- Simulation Configuration ---const config = {numRacks: 48,baseServerPowerPerRack: 2.5, // kW per rack at idlemaxServerPowerPerRack: 6.0,  // kW per rack at 100% loadbaseCoolingPowerFraction: 0.4, // Cooling power as fraction of IT power at low loadcoolingIncreaseFactor: 0.6, // How much cooling increases with IT loadnetworkPower: 15, // Constant network power (kW)otherLoadsPower: 10, // Other infrastructure power (kW)optimalTempRange: [20, 25], // degrees CwarningTempOffset: 3, // Temp degrees above optimal for warningcriticalTempOffset: 6, // Temp degrees above optimal for criticaltempFluctuation: 1.5, // Max random temp fluctuation per rackpowerFluctuation: 0.5, // Max random power fluctuation per rack (kW)humidityRange: [40, 60], // % RHupdateInterval: 2000, // MillisecondstrendChartPoints: 30, // Number of points to show on the trend chartpueWarningLevel: 1.6,pueCriticalLevel: 1.8,};// --- Simulation State ---let serverLoadPercent = parseInt(simLoadSlider.value, 10);let racks = []; // Array of { id, serverPower, temperature, status } objectslet totalITPower = 0;let totalCoolingPower = 0;let totalDataCenterPower = 0;let pue = 1.0;let averageTemperature = 0;let humidity = 50;let simulationTimer = null;let powerTrendData = Array(config.trendChartPoints).fill(null);let trendChartLabels = Array(config.trendChartPoints).fill('');// --- Chart Instances ---let powerBreakdownChart = null;let powerTrendChart = null;// --- Utility Functions ---function getRandom(min, max) {return Math.random() * (max - min) + min;}function formatTimeLabel(date) {const h = String(date.getHours()).padStart(2, '0');const m = String(date.getMinutes()).padStart(2, '0');const s = String(date.getSeconds()).padStart(2, '0');return `${h}:${m}:${s}`;}// --- Initialization Functions ---function initializeRacks() {racks = [];for (let i = 0; i < config.numRacks; i++) {const rackId = `R${String(i + 1).padStart(2, '0')}`;racks.push({id: rackId,serverPower: 0, // kW, will be calculatedtemperature: getRandom(config.optimalTempRange[0], config.optimalTempRange[1]), // Initial temp Cstatus: 'normal' // normal, warning, critical, offline});}}function initializeCharts() {const breakdownCtx = powerBreakdownCanvas.getContext('2d');powerBreakdownChart = new Chart(breakdownCtx, {type: 'doughnut', // Or 'pie'data: {labels: ['服务器', '冷却系统', '网络设备', '其他负载'],datasets: [{data: [0, 0, 0, 0],backgroundColor: ['rgba(0, 122, 255, 0.8)', // Accent Blue'rgba(52, 199, 89, 0.8)', // Accent Green'rgba(255, 149, 0, 0.8)', // Accent Orange'rgba(142, 142, 147, 0.8)' // Gray],borderColor: 'rgba(255, 255, 255, 0.5)',borderWidth: 1}]},options: {responsive: true,maintainAspectRatio: false,plugins: {legend: {position: 'bottom',labels: { font: { size: 11 } }}}}});const trendCtx = powerTrendCanvas.getContext('2d');powerTrendChart = new Chart(trendCtx, {type: 'line',data: {labels: trendChartLabels,datasets: [{label: '总功耗 (kW)',data: powerTrendData,borderColor: 'rgba(0, 122, 255, 1)',backgroundColor: 'rgba(0, 122, 255, 0.1)',fill: true,tension: 0.3, // Smoother linepointRadius: 0, // Hide pointspointHoverRadius: 4}]},options: {responsive: true,maintainAspectRatio: false,scales: {y: {beginAtZero: false,ticks: { font: { size: 10 } }},x: {ticks: { font: { size: 10 }, maxRotation: 0, autoSkipPadding: 15 }}},plugins: {legend: { display: false }},animation: {duration: 300 // Faster animation for smoother updates}}});}// --- Simulation Logic ---function updateSimulationData() {totalITPower = 0;let totalTemperature = 0;let activeRacks = 0;// 1. Update Rack Status (Power & Temp based on load)racks.forEach(rack => {if (rack.status === 'offline') return; // Skip offline racks// Calculate server power based on load and fluctuationconst basePower = config.baseServerPowerPerRack;const range = config.maxServerPowerPerRack - basePower;rack.serverPower = basePower + (range * (serverLoadPercent / 100));rack.serverPower += getRandom(-config.powerFluctuation, config.powerFluctuation);rack.serverPower = Math.max(0.1, rack.serverPower); // Ensure minimum powertotalITPower += rack.serverPower;// Calculate temperature based on power and fluctuation// Simple model: temp increases with power, modified by fluctuationconst tempIncreaseDueToPower = (rack.serverPower / config.maxServerPowerPerRack) * (config.criticalTempOffset + 2); // More power = higher potential tempconst baseTemp = config.optimalTempRange[0]; // Start from low optimalrack.temperature = baseTemp + tempIncreaseDueToPower + getRandom(-config.tempFluctuation, config.tempFluctuation);rack.temperature = Math.max(15, rack.temperature); // Floor temp// Determine rack status based on temperatureconst criticalThreshold = config.optimalTempRange[1] + config.criticalTempOffset;const warningThreshold = config.optimalTempRange[1] + config.warningTempOffset;if (rack.temperature >= criticalThreshold) {rack.status = 'critical';} else if (rack.temperature >= warningThreshold) {rack.status = 'warning';} else {rack.status = 'normal';}totalTemperature += rack.temperature;activeRacks++;});// 2. Calculate Cooling Power// Cooling power increases with IT powerconst itPowerRatio = totalITPower / (config.numRacks * config.maxServerPowerPerRack); // Ratio of current IT load to max possibleconst coolingFraction = config.baseCoolingPowerFraction + (config.coolingIncreaseFactor * itPowerRatio);totalCoolingPower = totalITPower * coolingFraction;totalCoolingPower = Math.max(5, totalCoolingPower); // Minimum cooling power// 3. Calculate Total Power and PUEtotalDataCenterPower = totalITPower + totalCoolingPower + config.networkPower + config.otherLoadsPower;pue = (totalITPower > 0) ? totalDataCenterPower / totalITPower : 1.0;// 4. Calculate Average Temperature & HumidityaverageTemperature = activeRacks > 0 ? totalTemperature / activeRacks : config.optimalTempRange[0];// Simple humidity fluctuationhumidity += getRandom(-1, 1);humidity = Math.max(config.humidityRange[0] - 5, Math.min(config.humidityRange[1] + 5, humidity)); // Keep within broader bounds// 5. Update Trend Chart DatapowerTrendData.shift();powerTrendData.push(totalDataCenterPower);trendChartLabels.shift();trendChartLabels.push(formatTimeLabel(new Date()));// 6. Check for Alerts/SuggestionsgenerateAlerts();}// --- UI Update Functions ---function updateUI() {totalPowerSpan.textContent = `${totalDataCenterPower.toFixed(1)} kW`;pueValueSpan.textContent = pue.toFixed(2);avgTempSpan.textContent = `${averageTemperature.toFixed(1)} °C`;humiditySpan.textContent = `${humidity.toFixed(0)} %`;// Update Breakdown Chartif (powerBreakdownChart) {powerBreakdownChart.data.datasets[0].data = [totalITPower,totalCoolingPower,config.networkPower,config.otherLoadsPower];powerBreakdownChart.update('none'); // Update without animation}// Update Trend Chartif (powerTrendChart) {powerTrendChart.data.labels = trendChartLabels;powerTrendChart.data.datasets[0].data = powerTrendData;powerTrendChart.update(); // Update with animation}// Update Rack GridupdateRackGrid();}function updateRackGrid() {rackGridDiv.innerHTML = ''; // Clear previous indicatorsracks.forEach(rack => {const indicator = document.createElement('div');indicator.classList.add('rack-indicator', `rack-status-${rack.status}`);indicator.dataset.rackId = rack.id;indicator.innerHTML = `<span class="rack-id">${rack.id}</span><span class="rack-power">${rack.serverPower.toFixed(1)}kW</span><span class="rack-temp">${rack.temperature.toFixed(1)}°C</span>`;// Add click listener for details (future)indicator.addEventListener('click', () => {addLog(`点击了机架 ${rack.id}: 状态 ${rack.status}, 功率 ${rack.serverPower.toFixed(1)}kW, 温度 ${rack.temperature.toFixed(1)}°C`, 'info');});rackGridDiv.appendChild(indicator);});}function addLog(message, type = 'info') {// Check if a similar recent message exists to avoid spamconst existingMessages = Array.from(alertListUl.children).map(li => li.textContent);if (existingMessages.some(msg => msg.includes(message.substring(0, 50)))) { // Simple check// Optional: maybe update timestamp or count of a repeating messagereturn;}const li = document.createElement('li');li.classList.add(`alert-${type}`);li.textContent = message;alertListUl.insertBefore(li, alertListUl.firstChild);if (alertListUl.children.length > 15) { // Limit log sizealertListUl.removeChild(alertListUl.lastChild);}}function generateAlerts() {// PUE Checkif (pue >= config.pueCriticalLevel) {addLog(`严重警告: PUE 达到 ${pue.toFixed(2)},远超目标值!`, 'critical');} else if (pue >= config.pueWarningLevel) {addLog(`警告: PUE 为 ${pue.toFixed(2)},偏高,请检查冷却效率。`, 'warning');}// Temperature Checkslet criticalRacks = racks.filter(r => r.status === 'critical');let warningRacks = racks.filter(r => r.status === 'warning');if (criticalRacks.length > 0) {addLog(`严重警告: ${criticalRacks.length} 个机架温度过高 (${criticalRacks.map(r=>r.id).slice(0,3).join(', ')}...)!`, 'critical');}if (warningRacks.length > 0 && criticalRacks.length === 0) { // Show warning only if no critical racksaddLog(`警告: ${warningRacks.length} 个机架温度偏高 (${warningRacks.map(r=>r.id).slice(0,3).join(', ')}...)`, 'warning');}// Simple Suggestion based on load & PUEif (serverLoadPercent < 30 && pue > 1.5) {addLog(`建议: 当前负载较低 (${serverLoadPercent}%) 但PUE (${pue.toFixed(2)}) 偏高,考虑整合或关闭部分空闲服务器。`, 'suggestion');}if (averageTemperature > config.optimalTempRange[1] + 1 && totalCoolingPower / totalDataCenterPower < 0.35) {addLog(`建议: 平均温度 (${averageTemperature.toFixed(1)}°C) 略高,冷却功耗占比较低,可适当增加冷却输出。`, 'suggestion');}}// --- Event Handlers ---simLoadSlider.addEventListener('input', (e) => {serverLoadPercent = parseInt(e.target.value, 10);simLoadValueSpan.textContent = `${serverLoadPercent}%`;// No need to call updateSimulationData immediately, the loop will pick it up});triggerEventBtn.addEventListener('click', () => {const eventType = Math.random();if (eventType < 0.4) { // Simulate temp spike in a few racksconst numAffected = getRandomInt(1, 4);addLog(`事件: ${numAffected}个机架温度短暂飙升!`, 'warning');for(let i=0; i<numAffected; i++) {const rackIndex = getRandomInt(0, racks.length - 1);if(racks[rackIndex].status !== 'offline') {racks[rackIndex].temperature += getRandom(5, 10); // Sudden increase}}} else if (eventType < 0.7) { // Simulate power surgeaddLog(`事件: IT负载短暂飙升!`, 'warning');const originalLoad = serverLoadPercent;serverLoadPercent = Math.min(100, originalLoad + getRandomInt(20, 40));simLoadSlider.value = serverLoadPercent;simLoadValueSpan.textContent = `${serverLoadPercent}%`;setTimeout(() => { // Return to normal after a bitserverLoadPercent = originalLoad;simLoadSlider.value = serverLoadPercent;simLoadValueSpan.textContent = `${serverLoadPercent}%`;addLog(`事件: IT负载恢复正常`, 'info');}, 8000);} else { // Simulate rack offlineconst rackIndex = getRandomInt(0, racks.length - 1);if (racks[rackIndex].status !== 'offline') {racks[rackIndex].status = 'offline';racks[rackIndex].serverPower = 0;racks[rackIndex].temperature = 18; // Assume offline is cooladdLog(`事件: 机架 ${racks[rackIndex].id} 意外离线!`, 'critical');}}// Force immediate update after event for responsivenessupdateSimulationData();updateUI();});function getRandomInt(min, max) { // Need this helper toomin = Math.ceil(min);max = Math.floor(max);return Math.floor(Math.random() * (max - min + 1)) + min;}// --- Main Simulation Loop ---function startSimulation() {if (simulationTimer) clearInterval(simulationTimer);initializeRacks();if (!powerBreakdownChart || !powerTrendChart) {initializeCharts();}addLog('模拟系统启动', 'info');simStatusSpan.textContent = '运行中';// Initial updateupdateSimulationData();updateUI();// Start the loopsimulationTimer = setInterval(() => {updateSimulationData();updateUI();}, config.updateInterval);}// --- Initial Setup ---startSimulation();
});