DeepSeek | AI需求分析
运行环境:jupyter notebook (python 3.12.7) + Dash
场景:
收集了小程序的问题点和优化建议,一键AI分析,快速排优先级
指令话术:
对收集的小程序问题点和建议,做需求分析并总结形成报告,报告结构:
1.核心问题总结
汇总数据概况
列出3-5条关键问题
2.优先级清单,表格形式
分类并列出数据支撑的明细内容
标注优先级P0-P3、影响范围、实现成本、用户价值、解决方案、责任人、工期、工期依据
用红色标注高优先级、高价值、低成本
注:用户价值=对核心业务和用户体验的影响,实现成本=开发资源与时间投入)
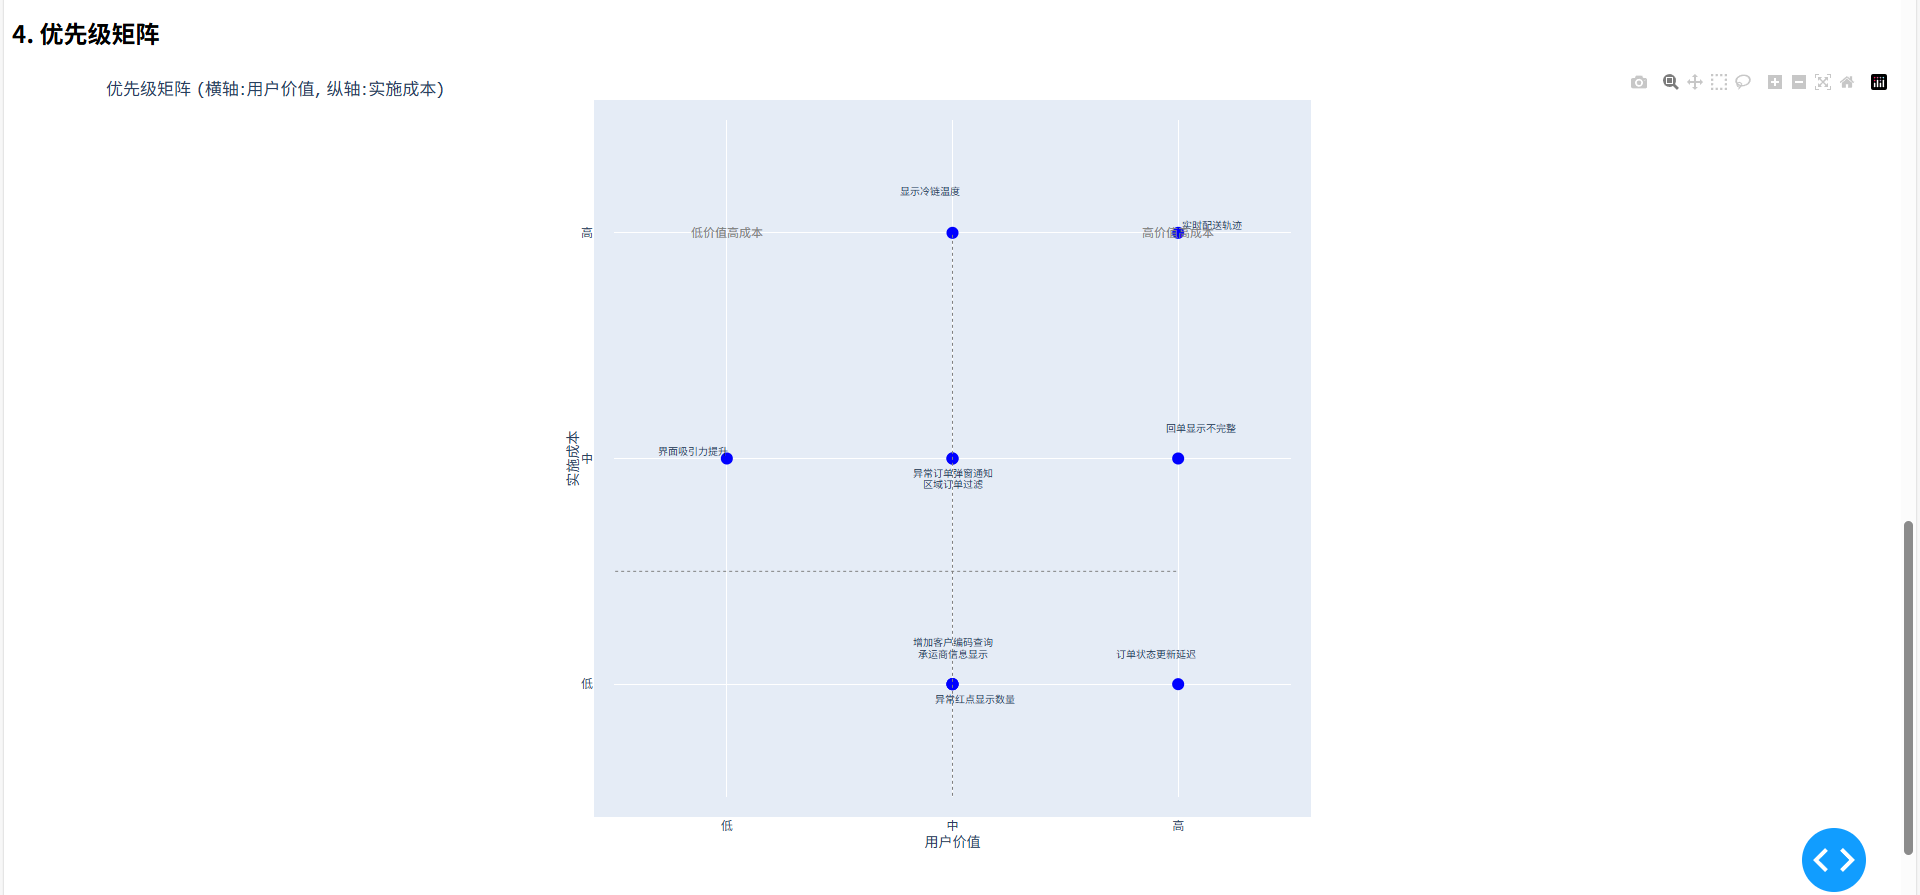
3. 优先级矩阵
横轴为用户价值,纵轴为实现成本,分四个象限标注需求项
4.详细分析
根因+数据支撑
5.用Python的Dash框架将以上报告做成Dashboard,给出完整可运行的代码
+附件《小程序的问题点和优化建议》或直接黏贴全文
代码:
pip install dash plotly pandas matplotlibimport dash
from dash import dcc, html, Input, Output
import plotly.express as px
import pandas as pd
import plotly.graph_objects as go# 准备数据
issues_data = {"分类": ["数据问题", "数据问题", "查询功能", "查询功能", "界面优化", "功能增强", "功能增强", "界面优化", "功能增强", "通知系统"],"问题描述": ["回单显示不完整", "订单状态更新延迟", "增加客户编码查询", "区域订单过滤", "异常红点显示数量", "显示冷链温度", "实时配送轨迹", "界面吸引力提升", "承运商信息显示", "异常订单弹窗通知"],"优先级": ["P0", "P0", "P1", "P1", "P2", "P1", "P1", "P3", "P1", "P2"],"影响范围": ["高", "高", "中", "中", "低", "中", "中", "低", "中", "中"],"实现成本": ["中", "低", "低", "中", "低", "high", "high", "中", "低", "中"],"用户价值": ["高", "高", "中", "中", "中", "中", "高", "低", "中", "中"],"解决方案": ["优化回单显示逻辑", "增加状态同步机制", "扩展查询条件", "增加区域筛选", "优化红点逻辑", "接入温度数据", "集成地图API", "UI优化", "扩展订单详情", "实现通知机制"],"责任人": ["前端组", "后端组", "前端组", "全栈组", "前端组", "后端组", "全栈组", "设计组", "前端组", "全栈组"],"工期": ["2周", "1周", "1周", "2周", "3天", "3周", "4周", "2周", "1周", "2周"],"复杂度": ["中等", "简单", "简单", "中等", "简单", "complex", "complex", "中等", "simple", "中等"]
}df = pd.DataFrame(issues_data)# 创建Dash应用
app = dash.Dash(__name__)app.layout = html.Div([html.H1("小程序问题与建议需求分析仪表板", style={'textAlign': 'center'}),# 访问提示 - 添加在标题下方html.Div([html.P("访问 http://localhost:8050 查看Dashboard", style={'textAlign': 'center', 'color': '#666', 'fontStyle': 'italic'})], style={'marginBottom': '20px'}),# 第一部分:核心问题总结html.Div([html.H2("1. 核心问题总结"),html.Ul([html.Li("数据完整性与显示问题:多个地区反馈数据不全、显示不一致、回单显示不完整等问题"),html.Li("查询功能不足:查询条件不足、区域过滤需求、实时数据更新问题"),html.Li("订单状态管理问题:状态更新延迟、异常通知不足"),html.Li("界面与用户体验问题:界面吸引力不足、信息展示不直观"),html.Li("功能缺失:缺少关键业务功能如冷链温度显示、配送轨迹、承运商信息")])], style={'marginBottom': '30px'}),# 第二部分:优先级清单html.Div([html.H2("2. 优先级清单"),html.Div([dcc.Dropdown(id='priority-filter',options=[{'label': '全部', 'value': '全部'}] + [{'label': p, 'value': p} for p in df['优先级'].unique()],value='全部',style={'width': '200px'})]),html.Div(id='priority-table-container'),html.P("*红色标注项为高优先级高价值低成本的需求", style={'color': 'red', 'fontStyle': 'italic'})], style={'marginBottom': '30px'}),# 第三部分:详细分析html.Div([html.H2("3. 详细分析"),html.Div([dcc.Graph(id='issue-distribution'),html.H4("根因分析:"),html.Ul([html.Li("后端API未返回完整数据,前端未正确处理所有数据字段"),html.Li("初期设计未考虑区域过滤需求,实时数据更新机制不完善"),html.Li("状态同步机制存在延迟,异常检测与通知系统不完善"),html.Li("初期以功能为主,UI设计投入不足,信息展示未充分考虑业务场景需求")]),html.P("共收集到23条反馈,其中数据相关问题7条(30%),查询功能问题5条(22%),状态管理问题4条(17%),界面问题3条(13%),功能增强需求4条(17%)")])], style={'marginBottom': '30px'}),# 第四部分:优先级矩阵html.Div([html.H2("4. 优先级矩阵"),dcc.Graph(id='priority-matrix', style={'height': '800px'}),html.Div([html.P("高价值低成本象限(右上): 回单显示优化, 状态同步机制, 客户编码查询, 承运商信息显示"),html.P("高价值高成本象限(左上): 实时配送轨迹, 冷链温度显示"),html.P("低价值低成本象限(右下): 异常红点数量, 界面吸引力"),html.P("低价值高成本象限(左下): (当前无需求落在此区域)")], style={'marginTop': '20px'})], style={'marginBottom': '30px'})
])# 回调函数:过滤优先级表格
@app.callback(Output('priority-table-container', 'children'),Input('priority-filter', 'value')
)
def update_priority_table(selected_priority):if selected_priority == '全部':filtered_df = dfelse:filtered_df = df[df['优先级'] == selected_priority]def style_row(row):if row['优先级'] in ['P0', 'P1'] and row['用户价值'] == '高' and row['实现成本'] in ['低', '中']:return {'backgroundColor': 'rgba(255, 0, 0, 0.1)'}else:return {}table = html.Table([html.Thead(html.Tr([html.Th(col) for col in filtered_df.columns])),html.Tbody([html.Tr([html.Td(filtered_df.iloc[i][col], style=style_row(filtered_df.iloc[i])) for col in filtered_df.columns]) for i in range(len(filtered_df))])], style={'width': '100%', 'borderCollapse': 'collapse', 'marginTop': '20px'})return table# 回调函数:更新问题分布图
@app.callback(Output('issue-distribution', 'figure'),Input('priority-filter', 'value')
)
def update_issue_distribution(selected_priority):if selected_priority == '全部':dist_df = df['分类'].value_counts().reset_index()else:dist_df = df[df['优先级'] == selected_priority]['分类'].value_counts().reset_index()dist_df.columns = ['分类', '数量']fig = px.pie(dist_df, values='数量', names='分类', title='问题分类分布')return fig# 回调函数:更新优先级矩阵
@app.callback(Output('priority-matrix', 'figure'),Input('priority-filter', 'value')
)
def update_priority_matrix(selected_priority):value_map = {'高': 3, '中': 2, '低': 1}cost_map = {'high': 3, '中': 2, '低': 1}matrix_df = df.copy()matrix_df['价值数值'] = matrix_df['用户价值'].map(value_map)matrix_df['成本数值'] = matrix_df['实现成本'].map(cost_map)if selected_priority != '全部':matrix_df = matrix_df[matrix_df['优先级'] == selected_priority]label_positions = {"回单显示不完整": {"x": 0.1, "y": 0.1},"订单状态更新延迟": {"x": -0.1, "y": 0.1},"增加客户编码查询": {"x": 0, "y": 0.15},"区域订单过滤": {"x": 0, "y": -0.15},"异常红点显示数量": {"x": 0.1, "y": -0.1},"显示冷链温度": {"x": -0.1, "y": 0.15},"实时配送轨迹": {"x": 0.15, "y": 0},"界面吸引力提升": {"x": -0.15, "y": 0},"承运商信息显示": {"x": 0, "y": 0.1},"异常订单弹窗通知": {"x": 0, "y": -0.1}}fig = go.Figure()fig.add_trace(go.Scatter(x=matrix_df['价值数值'],y=matrix_df['成本数值'],mode='markers',marker=dict(size=12, color='blue'),hovertext=matrix_df['问题描述'],hoverinfo='text',showlegend=False))annotations = []for i, row in matrix_df.iterrows():label = row['问题描述']x_pos = row['价值数值']y_pos = row['成本数值']x_offset = label_positions.get(label, {}).get("x", 0)y_offset = label_positions.get(label, {}).get("y", 0)annotations.append(go.layout.Annotation(x=x_pos + x_offset,y=y_pos + y_offset,text=label,showarrow=False,font=dict(size=10),xanchor='center',yanchor='bottom'))fig.add_shape(type="line", x0=2, y0=0, x1=2, y1=3, line=dict(color="gray", width=1, dash="dot"))fig.add_shape(type="line", x0=0, y0=1.5, x1=3, y1=1.5, line=dict(color="gray", width=1, dash="dot"))fig.update_layout(title='优先级矩阵 (横轴:用户价值, 纵轴:实施成本)',xaxis=dict(title='用户价值',range=[0.5, 3.5],tickvals=[1, 2, 3],ticktext=['低', '中', '高'],constrain='domain'),yaxis=dict(title='实施成本',range=[0.5, 3.5],tickvals=[1, 2, 3],ticktext=['低', '中', '高'],scaleanchor="x",scaleratio=1),annotations=annotations,margin=dict(l=50, r=50, b=50, t=50, pad=20),height=800,hovermode='closest')fig.add_annotation(x=1, y=3, text="低价值高成本", showarrow=False, font=dict(color="gray"))fig.add_annotation(x=3, y=3, text="高价值高成本", showarrow=False, font=dict(color="gray"))fig.add_annotation(x=1, y=0, text="低价值低成本", showarrow=False, font=dict(color="gray"))fig.add_annotation(x=3, y=0, text="高价值低成本", showarrow=False, font=dict(color="gray"))return figif __name__ == '__main__':# 在启动时打印访问提示print("\n请访问 http://localhost:8050 查看Dashboard\n")app.run_server(debug=True, port=8050) # 端口默认8050,可调整8051 8052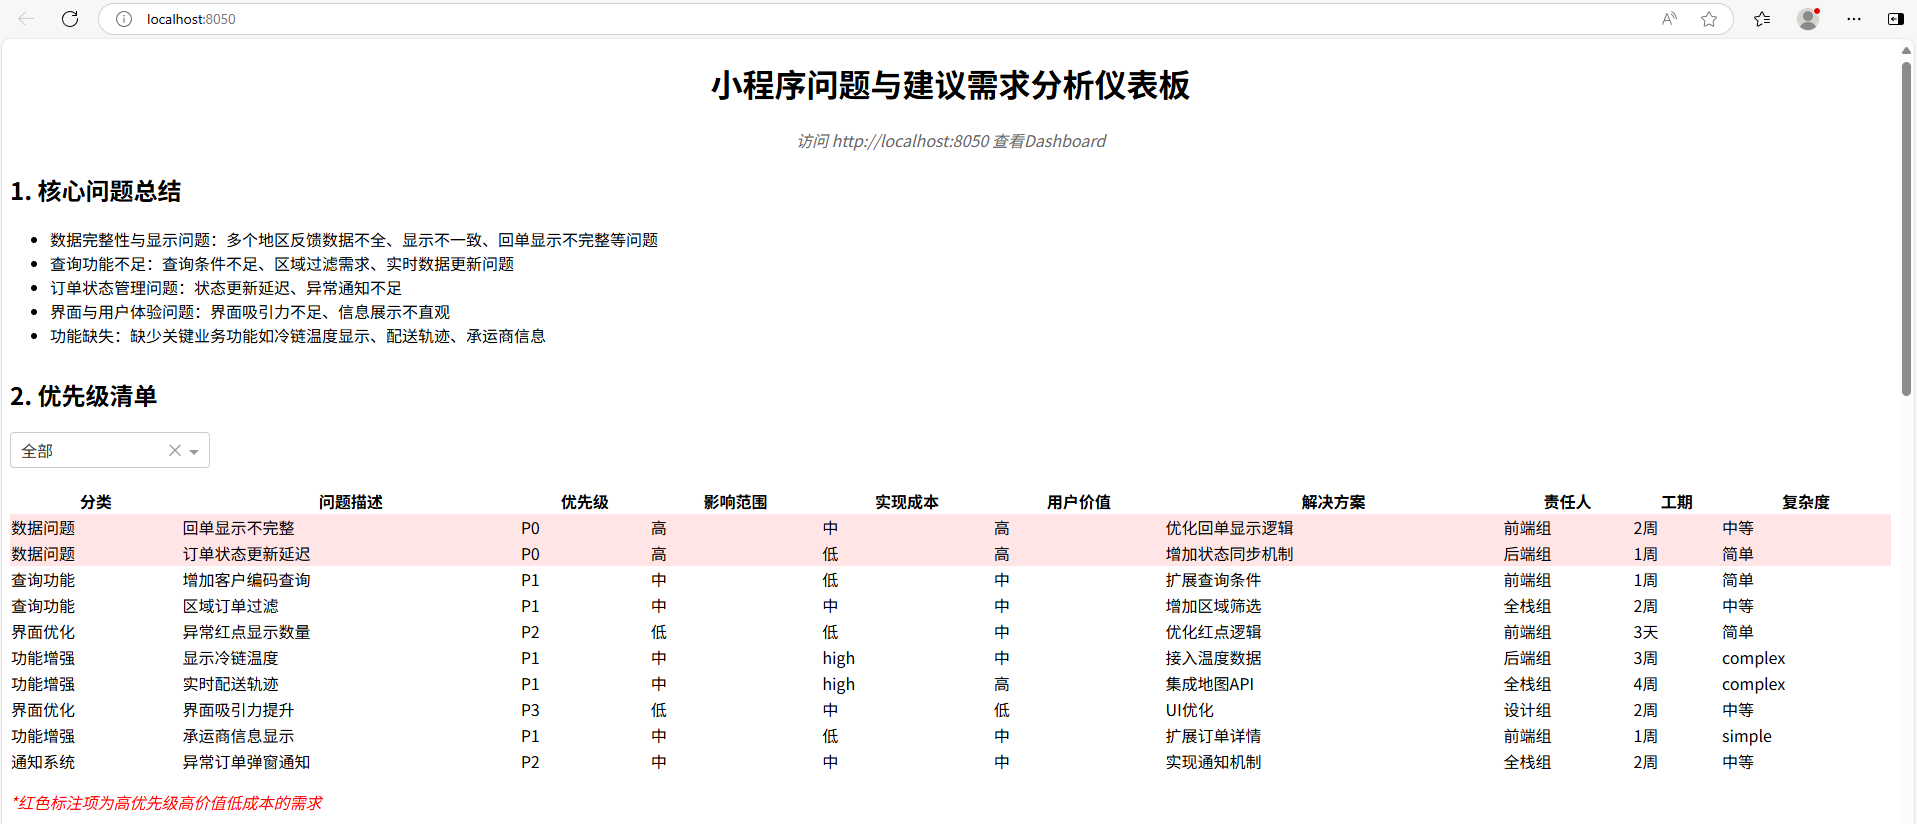


注意:
- 不同AI输出结果略有不同
- 相同输入条件,多次输出结果略有不同
- 输出代码偶尔还需要调试