Python 在世界地图上加气泡图
V1
import plotly.express as px
import pandas as pd# 数据准备
data = {"Country": ["Australia", "USA", "Germany", "South Korea", "New Zealand","China", "Japan", "Denmark", "Canada", "UK", "Italy","Singapore", "Netherlands", "Switzerland", "France", "Austria","South Africa", "Poland", "Portugal", "Sweden", "Croatia", "Greece"],"Value": [20, 19, 17, 16, 8, 6, 6, 5, 5, 4, 3, 2, 2, 2, 2, 1, 1, 1, 1, 1, 1, 1]
}df = pd.DataFrame(data)# 创建气泡地图
fig = px.scatter_geo(df,locations="Country",locationmode="country names",color="Value",size="Value",hover_name="Country",projection="natural earth",color_continuous_scale=px.colors.sequential.Plasma,title="World Map with Value-based Bubbles",size_max=30)# 自定义布局
fig.update_geos(showcountries=True, showcoastlines=True, showland=True,landcolor="lightgray", countrycolor="white")
fig.update_layout(margin={"r":0,"t":40,"l":0,"b":0})fig.show()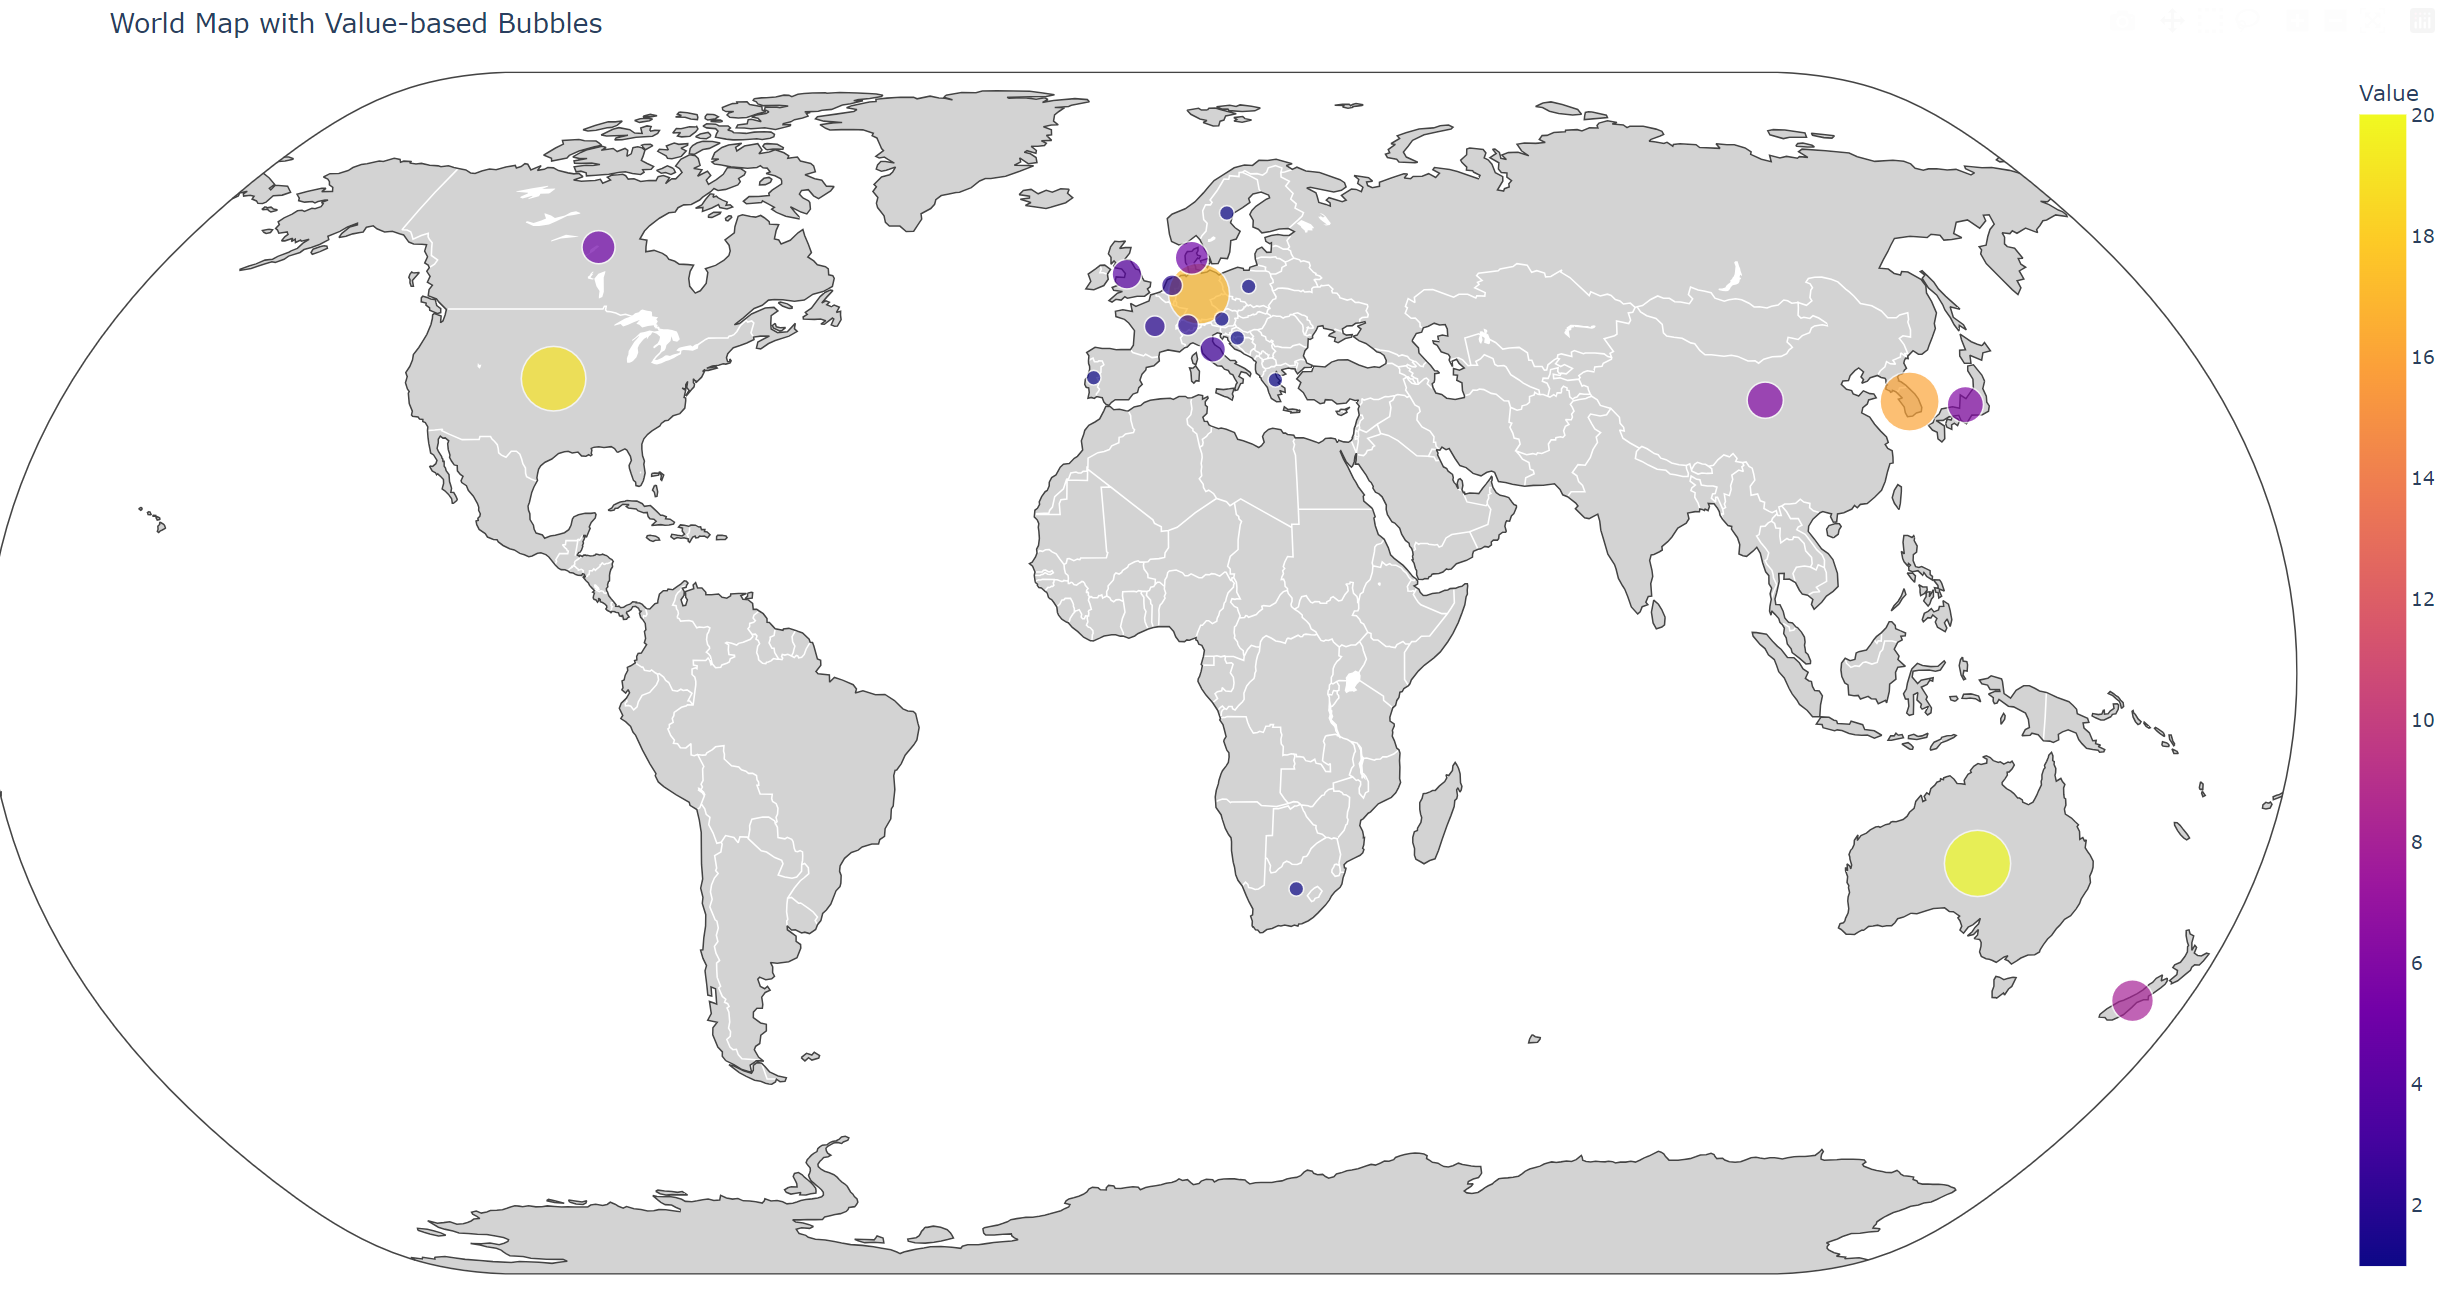
V2 标注国家及数理
import plotly.express as px
import pandas as pd# 数据准备
data = {"Country": ["Australia", "USA", "Germany", "South Korea", "New Zealand","China", "Japan", "Denmark", "Canada", "UK", "Italy","Singapore", "Netherlands", "Switzerland", "France", "Austria","South Africa", "Poland", "Portugal", "Sweden", "Croatia", "Greece"],"Value": [20, 19, 17, 16, 8, 6, 6, 5, 5, 4, 3, 2, 2, 2, 2, 1, 1, 1, 1, 1, 1, 1]
}df = pd.DataFrame(data)
df["Label"] = df["Country"] + " (" + df["Value"].astype(str) + ")"  # 创建标注文本# 创建气泡地图
fig = px.scatter_geo(df,locations="Country",locationmode="country names",color="Value",size="Value",hover_name="Country",text="Label",  # 添加文本标注projection="natural earth",color_continuous_scale=px.colors.diverging.Tealrose,title="World Value Distribution with Annotations",size_max=25)# 自定义样式
fig.update_traces(textposition="top center",  # 文本位置textfont=dict(family="Arial",size=12,color="black"),marker=dict(line=dict(width=0.5, color="gray"),  # 气泡边框opacity=0.8)
)# 优化地理特征
fig.update_geos(showcountries=True,countrycolor="lightgray",showcoastlines=False,showland=True,landcolor="white",showocean=True,oceancolor="azure"
)# 调整布局
fig.update_layout(margin={"r":20,"t":50,"l":20,"b":20},coloraxis_colorbar=dict(title="Value Scale",thickness=20,len=0.75),hoverlabel=dict(bgcolor="white",font_size=14)
)fig.show()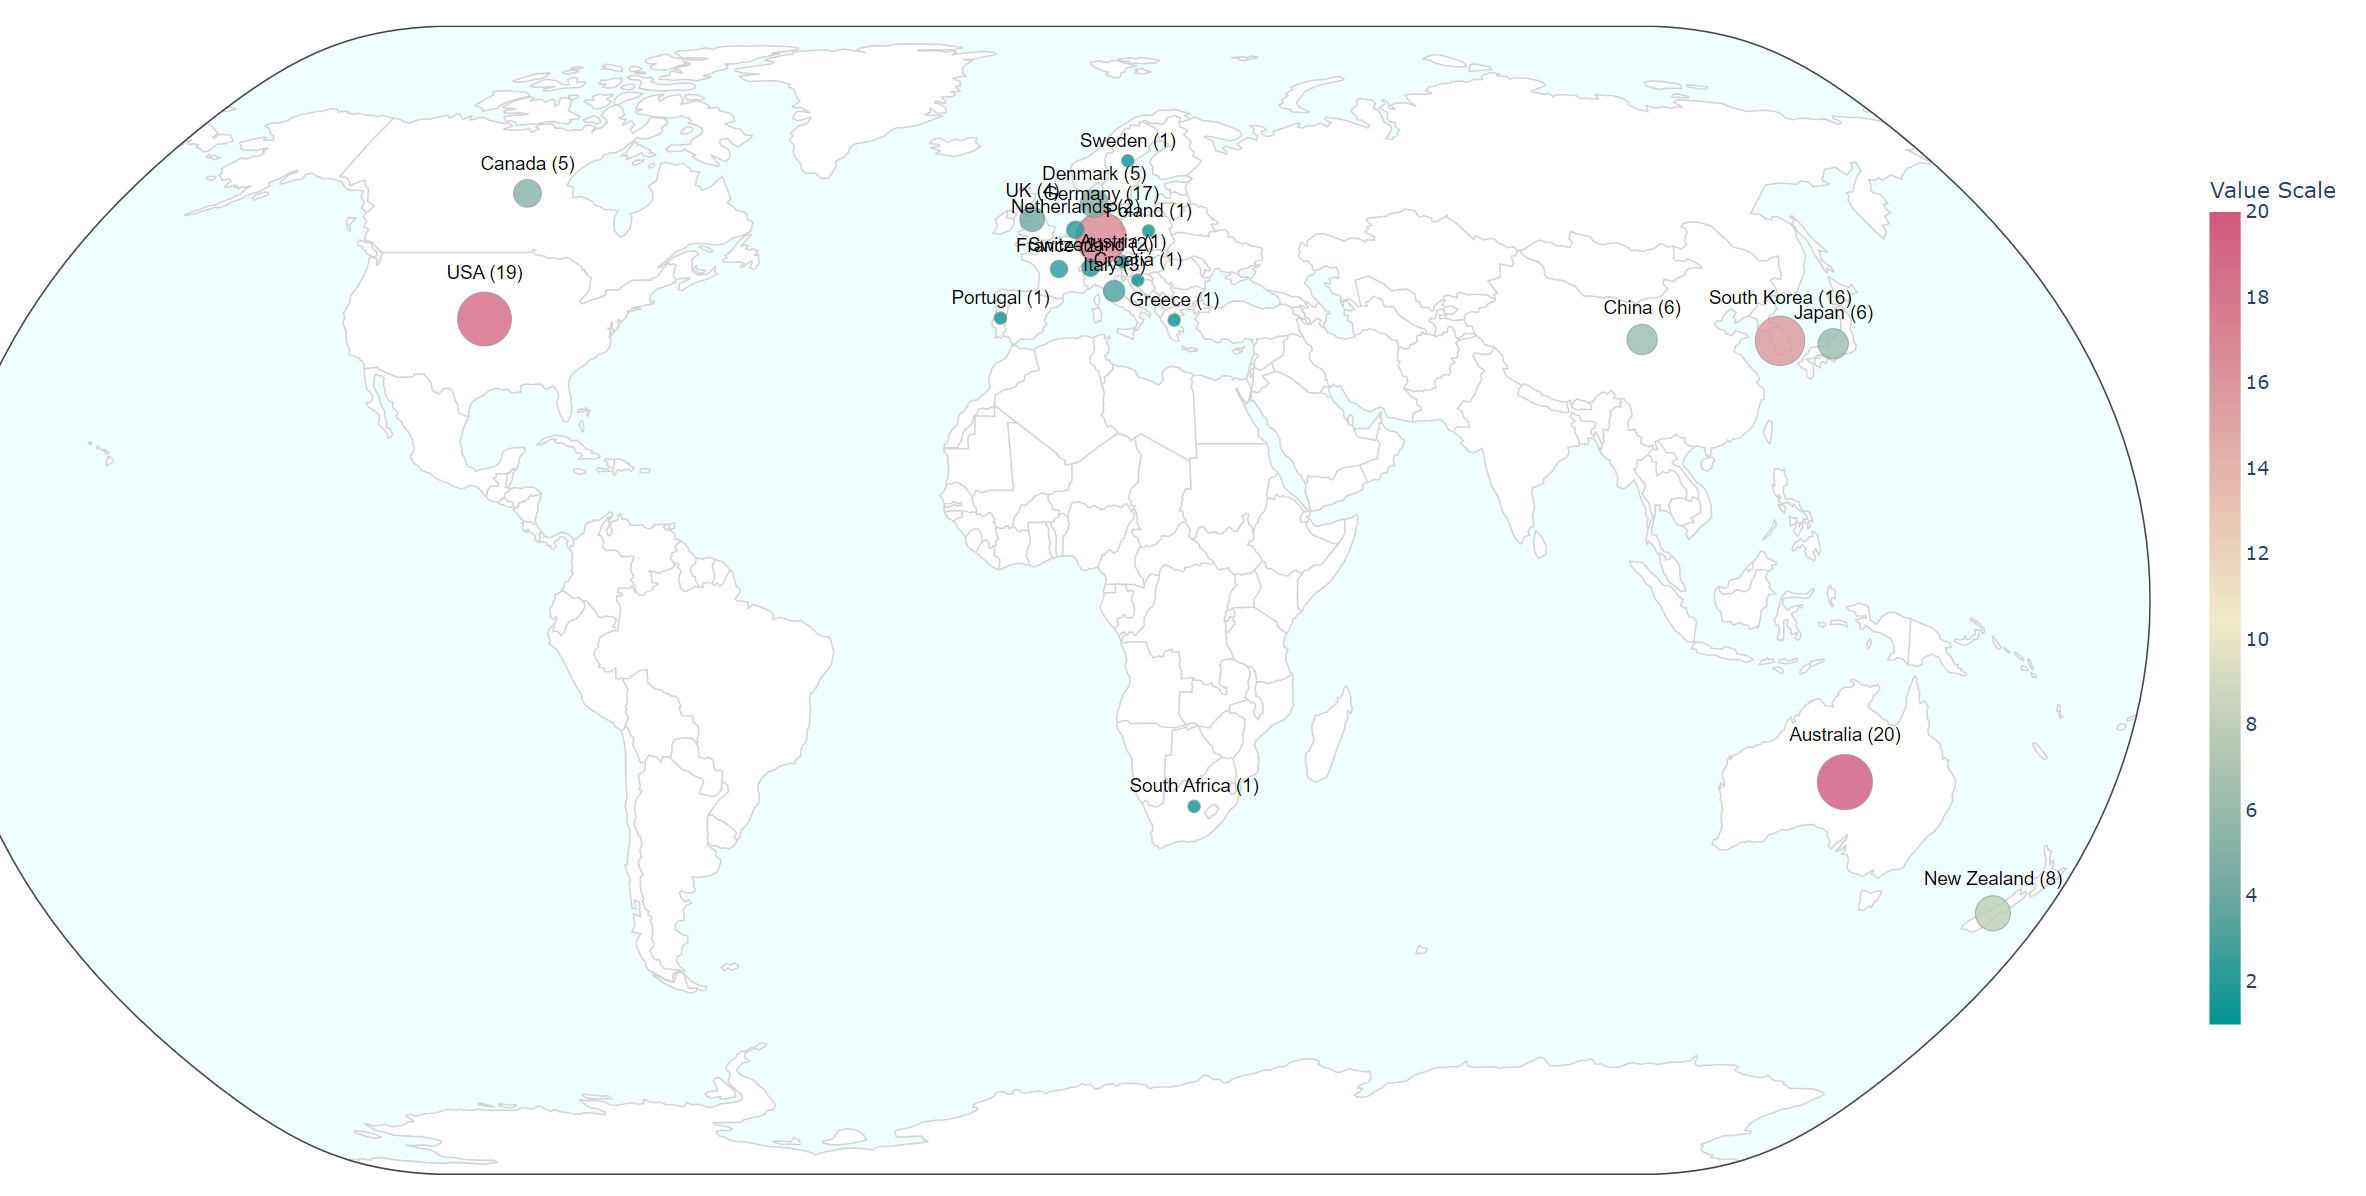
V3 标尺字体大小修改
import plotly.express as px
import pandas as pd# 数据准备
data = {"Country": ["Australia", "USA", "Germany", "South Korea", "New Zealand","China", "Japan", "Denmark", "Canada", "UK", "Italy","Singapore", "Netherlands", "Switzerland", "France", "Austria","South Africa", "Poland", "Portugal", "Sweden", "Croatia", "Greece"],"Value": [20, 19, 17, 16, 8, 6, 6, 5, 5, 4, 3, 2, 2, 2, 2, 1, 1, 1, 1, 1, 1, 1]
}df = pd.DataFrame(data)
df["Label"] = df["Country"] + " (" + df["Value"].astype(str) + ")"  # 创建标注文本# 创建气泡地图
fig = px.scatter_geo(df,locations="Country",locationmode="country names",color="Value",size="Value",hover_name="Country",text="Label",projection="natural earth",color_continuous_scale=px.colors.diverging.Tealrose,title="World Value Distribution with Annotations",size_max=50)# 自定义样式
fig.update_traces(textposition="top center",textfont=dict(family="Arial",size=22,color="black"),marker=dict(line=dict(width=0.5, color="gray"),opacity=0.8)
)# 优化地理特征
fig.update_geos(showcountries=True,countrycolor="lightgray",showcoastlines=False,showland=True,landcolor="white",showocean=True,oceancolor="azure"
)# 调整布局(重点修改部分)
fig.update_layout(margin={"r": 20, "t": 50, "l": 20, "b": 20},coloraxis_colorbar=dict(title="Value",thickness=30,len=0.65,# 新增字体设置tickfont=dict(    # 刻度数字字体size=25,      # 从默认12放大到14family="Arial")),hoverlabel=dict(bgcolor="white",font_size=30)
)fig.show()