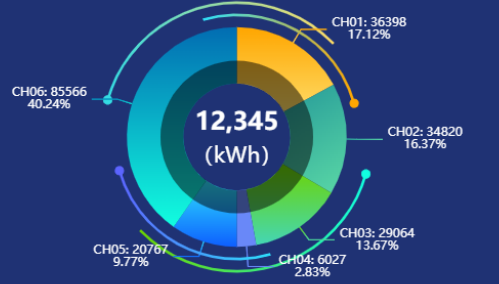
function drawPie(domId) {var chartDom = document.getElementById(domId);var myChart = echarts.init(chartDom);var angle = 0; var pieData = [];for (var i = 1; i <= 6; i++) {pieData.push({name: 'CH0' + i, value: parseInt(Math.random() * 1000 * 100)});}const YData = pieData.map(item => item.value)const sum = YData.reduce((item, index) => item + index, 0); var scale = 1;
var rich = {white: {color: "#fff",align: "center",fontSize: 12 * scale,},yellow: {color: "#ffc20e",fontSize: 20 * scale,padding: [5, 4],align: "center",},total: {color: "#ffc20e",fontSize: 18 * scale,align: "center",},blue: {color: "#49dff0",fontSize: 16 * scale,align: "center",},red: {color: "#ff0000",fontSize: 16 * scale,align: "center",}};option = {color: [{type: 'linear',x: 0, y: 0, x2: 0, y2: 1,colorStops: [{offset: 0, color: 'rgba(255, 166, 0, 1)' }, {offset: 1, color: 'rgba(254, 219, 101, 1)' }],global: false },{type: 'linear',x: 0, y: 0, x2: 1, y2: 1,colorStops: [{offset: 0, color: 'rgba(38, 154, 153, 1)' }, {offset: 1, color: 'rgba(90, 216, 166, 1)' }],global: false },{type: 'linear',x: 0, y: 0, x2: 0, y2: 1,colorStops: [{offset: 0, color: 'rgba(109, 212, 0, 1)' }, {offset: 1, color: 'rgba(68, 215, 182, 1)' }],global: false },{type: 'linear',x: 0, y: 0, x2: 1, y2: 1,colorStops: [{offset: 0, color: 'rgba(105, 136, 248, 1)' }, {offset: 1, color: 'rgba(105, 136, 248, 1)' }],global: false },{type: 'linear',x: 0, y: 0, x2: 0, y2: 1,colorStops: [{offset: 0, color: 'rgba(45, 225, 253, 1)' }, {offset: 1, color: 'rgba(14, 95, 255, 1)' }],global: false },{type: 'linear',x: 0, y: 0, x2: 0, y2: 1,colorStops: [{offset: 0, color: 'rgba(2, 109, 178, 1)' }, {offset: 1, color: 'rgba(18, 254, 224, 1)' }],global: false },],title: {text: "12,345",subtext: '(kWh)',textStyle: {color: "#fff",fontSize: 24,},subtextStyle: {fontSize: 21,color: "#fff",},x: "center",y: "40%",},grid: {bottom: 150,left: 100,right: "10%",},tooltip: {trigger: 'item'},series: [{name: '',type: 'pie',radius: ["35%", "72%"],center: ["50%", "50%"],data: pieData,avoidLabelOverlap: true, label: {normal: {show: true,formatter: function (param) {const percent = ((param.value / sum) * 100).toFixed(2);return ("{white|" + param.name + ": }{white|" + param.value + "}\n{white|" + percent + "%}");},rich: rich,},emphasis: {show: true,},},labelLine: {normal: {show: true,length: 15,length2: 25,},emphasis: {show: true,},},},{radius: ["35%", "50%"],center: ["50%", "50%"],type: "pie",label: {normal: {show: false,},emphasis: {show: false,},},labelLine: {normal: {show: false,},emphasis: {show: false,},},animation: false,tooltip: {show: false,},data: [{value: 1,itemStyle: {color: "rgba(0,0,0,0.5)",},},],},{type: 'custom',coordinateSystem: 'none',zlevel:100,renderItem: (params, api) => {return {type: 'arc',shape: {cx: api.getWidth() / 2,cy: api.getHeight() / 2,r: Math.min(api.getWidth(), api.getHeight()) / 2 * 0.80,startAngle: (270 + angle) * Math.PI / 180,endAngle: (360 + angle) * Math.PI / 180},style: {fill: 'transparent',stroke: new echarts.graphic.LinearGradient(0, 0, 1, 0, [{offset: 0, color: 'rgba(45, 225, 253, 1)' }, {offset: 1, color: 'rgba(255, 166, 0, 1)' }], false),lineWidth: 2.6},silent: true}},data: [0]},{type: 'custom',coordinateSystem: 'none',zlevel:100,renderItem: (params, api) => {debuggerreturn {type: 'arc',shape: {cx: api.getWidth() / 2,cy: api.getHeight() / 2,r: Math.min(api.getWidth(), api.getHeight()) / 2 * 0.80,startAngle: (90 + angle) * Math.PI / 180,endAngle: (180 + angle) * Math.PI / 180},style: {fill: 'transparent',stroke: new echarts.graphic.LinearGradient(0, 0, 1, 0, [{offset: 0, color: 'rgba(92, 100, 255, 1)' }, {offset: 1, color: 'rgba(45, 225, 253, 1)' }], false),lineWidth: 2.6},silent: true}},data: [0]},{type: 'custom',coordinateSystem: 'none',renderItem: (params, api) => {return {type: 'arc',shape: {cx: api.getWidth() / 2,cy: api.getHeight() / 2,r: Math.min(api.getWidth(), api.getHeight()) / 2 * 0.88,startAngle: (360 + -angle) * Math.PI / 180,endAngle: (120 + -angle) * Math.PI / 180},style: {fill: 'transparent',stroke: new echarts.graphic.LinearGradient(0, 0, 1, 0, [{offset: 0, color: 'rgba(109, 212, 0, 1)' }, {offset: 1, color: 'rgba(18, 254, 224, 1)' }], false),lineWidth: 2.6},silent: true}},data: [0]},{type: 'custom',coordinateSystem: 'none',renderItem: (params, api) => {return {type: 'arc',shape: {cx: api.getWidth() / 2,cy: api.getHeight() / 2,r: Math.min(api.getWidth(), api.getHeight()) / 2 * 0.88,startAngle: (180 + -angle) * Math.PI / 180,endAngle: (300 + -angle) * Math.PI / 180},style: {fill: 'transparent',stroke: new echarts.graphic.LinearGradient(0, 0, 1, 0, [{offset: 0, color: 'rgba(52, 220, 227, 1)' }, {offset: 1, color: 'rgba(254, 219, 101, 1)' }], false),lineWidth: 2.6},silent: true}},data: [0]},{type: 'custom',coordinateSystem: 'none',renderItem: (params, api) => {let x0 = api.getWidth() / 2;let y0 = api.getHeight() / 2;let r = Math.min(api.getWidth(), api.getHeight()) / 2 * 0.80;return {type: 'circle',shape: {cx: x0 + r * Math.cos((360 + angle) * Math.PI / 180),cy: y0 + r * Math.sin((360 + angle) * Math.PI / 180),r: 4},style: {fill: 'rgba(255, 166, 0, 1)',stroke: 'rgba(255, 166, 0, 1)'},silent: true}},data: [0]},{type: 'custom',coordinateSystem: 'none',renderItem: (params, api) => {let x0 = api.getWidth() / 2;let y0 = api.getHeight() / 2;let r = Math.min(api.getWidth(), api.getHeight()) / 2 * 0.80;return {type: 'circle',shape: {cx: x0 + r * Math.cos((180 + angle) * Math.PI / 180),cy: y0 + r * Math.sin((180 + angle) * Math.PI / 180),r: 4},style: {fill: 'rgba(92, 100, 255, 1)',stroke: 'rgba(92, 100, 255, 1)'},silent: true}},data: [0]},{type: 'custom',coordinateSystem: 'none',renderItem: (params, api) => {let x0 = api.getWidth() / 2;let y0 = api.getHeight() / 2;let r = Math.min(api.getWidth(), api.getHeight()) / 2 * 0.88;return {type: 'circle',shape: {cx: x0 + r * Math.cos((360 + -angle) * Math.PI / 180),cy: y0 + r * Math.sin((360 + -angle) * Math.PI / 180),r: 4},style: {fill: 'rgba(18, 254, 224, 1)',stroke: 'rgba(18, 254, 224, 1)'},silent: true}},data: [0]},{type: 'custom',coordinateSystem: 'none',renderItem: (params, api) => {let x0 = api.getWidth() / 2;let y0 = api.getHeight() / 2;let r = Math.min(api.getWidth(), api.getHeight()) / 2 * 0.88;return {type: 'circle',shape: {cx: x0 + r * Math.cos((180 + -angle) * Math.PI / 180),cy: y0 + r * Math.sin((180 + -angle) * Math.PI / 180),r: 4},style: {fill: 'rgba(52, 220, 227, 1)',stroke: 'rgba(52, 220, 227, 1)'},silent: true}},data: [0]},]};
let index = 0;
setInterval(function () {if (index >= option.series[0].data.length) {index = 0;}myChart.dispatchAction({type: "showTip", seriesIndex: 0,dataIndex: index });index += 1;}, 2000);option && myChart.setOption(option);setTimeout(function () {setInterval(() => {angle = angle + 2;myChart.setOption(option, true);}, 100)},1000)
}


