Prometheus实战教程:k8s平台-node-exporter监控物理机
监控图示
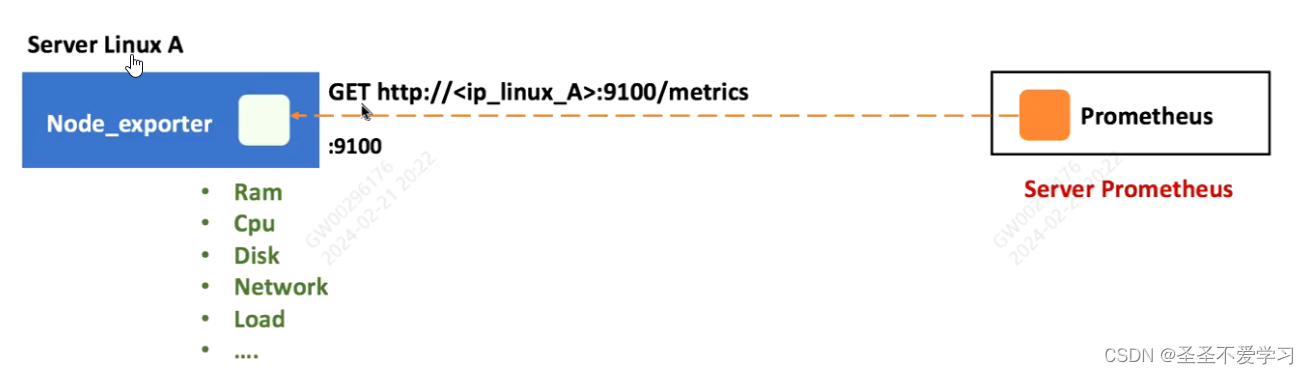
部署方式:
(1)docker或docker-compose部署 (本文使用)
(2)二进制
(3)kubernetes中使用daemonset
步骤 1:准备工作
-
确保 Docker 已安装
在部署之前,确保你的系统已经安装了 Docker。可以通过以下命令检查 Docker 是否已安装:docker --version如果未安装,请参考 Docker 官方文档 进行安装。
-
拉取
node_exporter镜像
从 Docker Hub 或其他镜像仓库拉取node_exporter镜像:docker pull prom/node-exporter:v1.8.2
步骤 2:创建 docker-compose.yml 文件
在本地创建一个 docker-compose.yml 文件,内容如下:
version: '3'
services:node-exporter:image: prom/node-exporter:v1.8.2container_name: node-exporterports:- "9100:9100"restart: always
docker命令运行
docker run -d \--name node-exporter \-p 9100:9100 \--restart always \harbor.fq.com/prometheus/node-exporter:v1.8.2 步骤 3:启动 node_exporter
-
在终端中导航到包含
docker-compose.yml文件的目录。 -
运行以下命令启动
node_exporter:docker-compose up -d-d参数表示以“后台模式”运行。
步骤 4:验证 node_exporter 是否正常运行
-
检查容器状态
运行以下命令,确认容器是否正常运行:docker ps -f name=node-exporter输出示例:
CONTAINER ID IMAGE COMMAND STATUS PORTS NAMES abc123def456 prom/node-exporter:v1.8.2 "/bin/node_exporter" Up 5 minutes 0.0.0.0:9100->9100/tcp node-exporter -
访问
node_exporter指标接口
打开浏览器或使用curl访问node_exporter的指标接口:curl http://localhost:9100/metrics如果一切正常,你会看到类似以下的输出(这是 Prometheus 格式的指标数据):
# HELP go_gc_duration_seconds A summary of the GC invocation durations. # TYPE go_gc_duration_seconds summary go_gc_duration_seconds{quantile="0"} 0.000123 go_gc_duration_seconds{quantile="0.25"} 0.000456 ... -
检查日志
查看容器的日志,确认没有错误:docker logs node-exporter -
查看主机端口
[root@k8s-node03 ~]# ss -alutn |grep 9100
tcp    LISTEN     0      10240     *:9100                  *:*
tcp    LISTEN     0      10240  [::]:9100               [::]:*
---### **步骤 5:配置 Prometheus 抓取 `node_exporter` 数据**如果你使用 Prometheus 监控系统,需要将 `node_exporter` 添加到 Prometheus 的配置文件中。5. 编辑 Prometheus 的配置文件 `prometheus.yml`,添加以下内容:```yamlscrape_configs:- job_name: 'node_exporter'static_configs:- targets: ['<your-server-ip>:9100']将 <your-server-ip> 替换为运行 node_exporter 的服务器的 IP 地址。 示例:
# [root@k8s-master02 monitoring]# cat prometheus/prometheus.yml
global:scrape_interval: 15s   # 每 15 秒抓取一次数据evaluation_interval: 15salerting:alertmanagers:- static_configs:- targets: ['alertmanager:9093']scrape_configs:- job_name: 'prometheus'static_configs:- targets: ['localhost:9090']- job_name: 'node-exporter'static_configs:- targets: ['node-exporter:9100']- job_name: 'cadvisor'static_configs:- targets: ['cadvisor:8080']- job_name: 'pushgateway'static_configs:- targets: ['pushgateway:9091']- job_name: 'node-linux'static_configs:- targets: ['10.255.209.40:9100']
rule_files:- '/etc/prometheus/alert_rules.yml'-
重启 Prometheus 以加载新配置:
docker-compose restart prometheus -
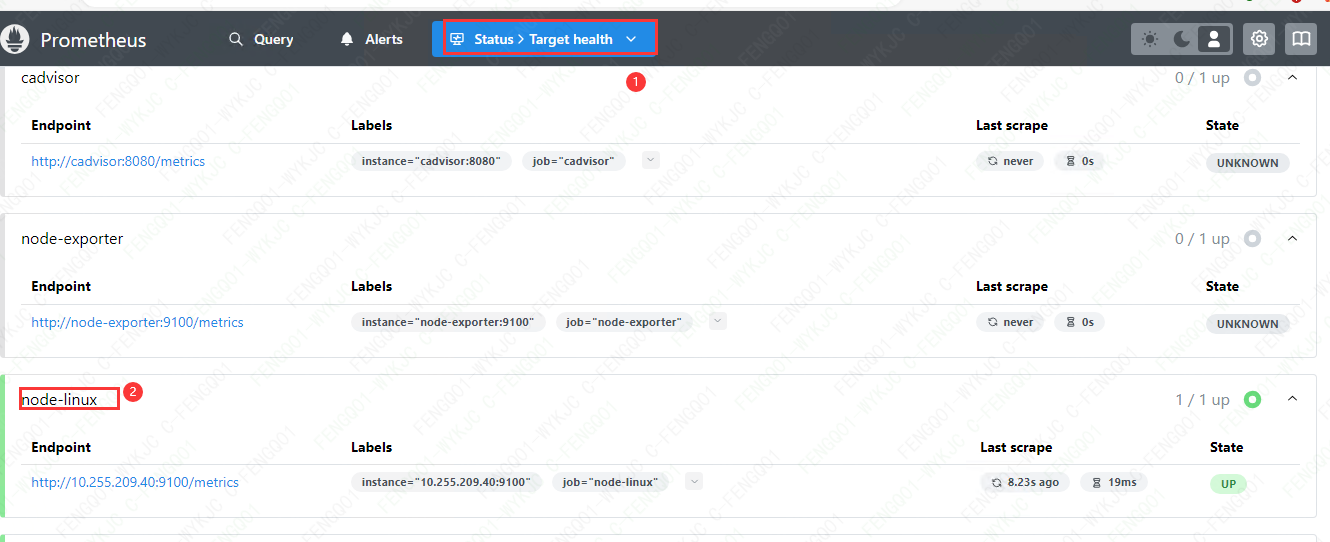
在 Prometheus 的 Web UI 中验证是否成功抓取数据:
- 打开 Prometheus 的 Web UI(默认地址:
http://localhost:9090)。 - 在搜索栏中输入
up,查看node_exporter的状态是否为1(表示正常)。
- 打开 Prometheus 的 Web UI(默认地址:
步骤 6:停止和清理
如果需要停止或删除 node_exporter 容器,可以运行以下命令: 3. 停止容器:
docker-compose down-
删除容器和镜像:
docker-compose down --rmi all