【APM】Build an environment for Traces, Metrics and Logs of App by OpenTelemetry
系列文章目录
此系列文章介绍如何搭建Observability(可观测性)环境(Opentelemetry-Collector、Tempo、Prometheus、Loki和Grafana),以及应用。
【APM】Observability Solution
【APM】Build an environment for Traces, Metrics and Logs of App by OpenTelemetry
【APM】NET Traces, Metrics and Logs to OLTP
【APM】How to enable Trace to Logs on Grafana?
前言
在现代化的分布式应用程序中,Observability(可观测性)对于监控、排查故障和优化性能至关重要。本系列文章显示如何整合OpenTelemetry、Opentelemetry-Collector、Tempo、Prometheus、Loki和Grafana来提升.NET应用程序的可观测性,以及使用Promtail收集Nginx access log,.NET应用程序通过Serilog 记录日志到Loki。
一、先决条件
在开始之前,确保你已经安装以下工具:
- Docker
- .NET SDK
二、Docker image download and re-tag
1.Download images
There are 8 images of docker that need to be downloaded.
- otel/opentelemetry-collector-contrib
- otel/opentelemetry-collector (not support exporter logs to loki, replaced by otel/opentelemetry-collector-contrib)
- grafana/tempo
- grafana/loki
- prom/prometheus
- grafana/grafana
- grafana/promtail
- your/nginx
The scripts as below:
docker pull  otel/opentelemetry-collector-contrib:latest
docker pull  otel/opentelemetry-collector:latest
docker pull  grafana/tempo:latest
docker pull  grafana/loki:latest
docker pull  prom/prometheus:latest
docker pull  grafana/grafana:latest
docker pull  grafana/promtail:latest
docker pull  your/nginx:latest
2.Get versions for each images
Use docker run, the sample code as below:
docker rm -f grafana
docker run -it -p 3000:3000 --rm -e http_proxy="" --name grafana grafana:latest# If you can't go to the container, please use the command: docker logs grafana, then get a version from the logs.
docker logs grafana...
3.Re-tag all images
The scripts as below:
# 当使用latest tag,会出现兼容性问题,故以程式的版本作为tag。
docker tag otel/opentelemetry-collector-contrib:latest otel/opentelemetry-collector-contrib:0.123.0
docker tag otel/opentelemetry-collector:latest otel/opentelemetry-collector:0.123.0
docker tag grafana/tempo:latest grafana/tempo:2.7.2
docker tag grafana/loki:latest grafana/loki:3.4.3
docker tag prom/prometheus:latest prom/prometheus:3.3.0
docker tag grafana/grafana:latest grafana/grafana:11.1.0
docker tag grafana/promtail:latest grafana/promtail:3.4.2
docker tag your/nginx:latest your/nginx:1.0.11# delete original images
docker rmi otel/opentelemetry-collector-contrib:latest
docker rmi otel/opentelemetry-collector:latest
docker rmi grafana/tempo:latest
docker rmi grafana/loki:latest
docker rmi prom/prometheus:latest
docker rmi grafana/grafana:latest
docker rmi grafana/promtail:latest
docker rmi your/nginx:latest
二、Setting configuration
1.loki.yaml
# This is a complete configuration to deploy Loki backed by the filesystem.
# The index will be shipped to the storage via tsdb-shipper.auth_enabled: falseserver:http_listen_port: 3100http_listen_address: 0.0.0.0  # 监听所有 IPv4 地址common:ring:instance_addr: 127.0.0.1kvstore:store: inmemoryreplication_factor: 1path_prefix: /tmp/lokischema_config:configs:- from: 2020-05-15store: tsdbobject_store: filesystemschema: v13index:prefix: index_period: 24hstorage_config:filesystem:directory: /tmp/loki/chunks
2.otel-collector.yaml
receivers:otlp:protocols:grpc:endpoint: 0.0.0.0:4317http:endpoint: 0.0.0.0:4318exporters:debug:verbosity: detailedprometheus:endpoint: ":9201"send_timestamps: truemetric_expiration: 180menable_open_metrics: trueotlp:endpoint: tempo:4317tls:insecure: true# 转发 Logs 到 Lokiloki:endpoint: "http://loki:3100/loki/api/v1/push"tls:insecure: truedefault_labels_enabled:exporter: truejob: true service:pipelines:traces:receivers: [otlp]exporters: [debug, otlp]metrics:receivers: [otlp]exporters: [debug, prometheus]logs:receivers: [otlp]exporters: [debug, loki]3.prometheus.yaml
global:scrape_interval: 15sevaluation_interval: 15sscrape_configs:- job_name: 'otel'static_configs:- targets: [ 'otel-collector:9201' ]4.promtail-config.yaml
# Promtail服务配置
server:http_listen_port: 9080grpc_listen_port: 0# 记录读取日志的位置信息文件,Promtail重新启动时需要它
positions:filename: /run/promtail/positions.yaml# Loki的api服务的地址
clients:- url: http://loki:3100/loki/api/v1/pushscrape_configs:
# nginx日志收集并打标签- job_name: nginx_logs # 服务名称static_configs:- targets:- localhost # 目标服务器名称labels:job: nginx # 作业名称host: localhost # 服务器地址__path__: /var/log/nginx/*.log #服务器日志路径
5.tempo.yaml
server:http_listen_port: 3200distributor:receivers:otlp:protocols:http:endpoint: "0.0.0.0:4318"grpc:endpoint: "0.0.0.0:4317"storage:trace:backend: localwal:path: /tmp/tempo/wallocal:path: /tmp/tempo/blocks6.grafana-datasources.yaml
apiVersion: 1datasources:
- name: Prometheustype: prometheusuid: prometheusaccess: proxyorgId: 1url: http://prometheus:9090basicAuth: falseisDefault: trueversion: 1editable: falsejsonData:httpMethod: GETexemplarTraceIdDestinations:- name: trace_iddatasourceUid: Tempo
- name: Tempotype: tempoaccess: proxyorgId: 1url: http://tempo:3200basicAuth: falseisDefault: falseversion: 1editable: falseapiVersion: 1uid: tempojsonData:httpMethod: GETserviceMap:datasourceUid: prometheus
7.nginx-custom.conf
# user  myuser;worker_processes auto;  # 自动计算可用CPU核数来决定worker进程的数量
pid /tmp/nginx.pid;     # 将PID文件放到/tmp下避免权限问题events {worker_connections 1024;  # 最大连接数
}http {include       /etc/nginx/mime.types;  # 默认MIME类型配置default_type  application/octet-stream;sendfile        on;  # 打开高效传输模式keepalive_timeout  65;  # 长连接保持时间log_format json_analytics escape=json '{''"msec": "$msec", ' # request unixtime in seconds with a milliseconds resolution'"connection": "$connection", ' # connection serial number'"connection_requests": "$connection_requests", ' # number of requests made in connection'"pid": "$pid", ' # process pid'"request_id": "$request_id", ' # the unique request id'"request_length": "$request_length", ' # request length (including headers and body)'"remote_addr": "$remote_addr", ' # client IP'"remote_user": "$remote_user", ' # client HTTP username'"remote_port": "$remote_port", ' # client port'"time_local": "$time_local", ''"time_iso8601": "$time_iso8601", ' # local time in the ISO 8601 standard format'"request": "$request", ' # full path no arguments if the request'"request_uri": "$request_uri", ' # full path and arguments if the request'"args": "$args", ' # args'"status": "$status", ' # response status code'"body_bytes_sent": "$body_bytes_sent", ' # the number of body bytes exclude headers sent to a client'"bytes_sent": "$bytes_sent", ' # the number of bytes sent to a client'"http_referer": "$http_referer", ' # HTTP referer'"http_user_agent": "$http_user_agent", ' # user agent'"http_x_forwarded_for": "$http_x_forwarded_for", ' # http_x_forwarded_for'"http_host": "$http_host", ' # the request Host: header'"server_name": "$server_name", ' # the name of the vhost serving the request'"request_time": "$request_time", ' # request processing time in seconds with msec resolution'"upstream": "$upstream_addr", ' # upstream backend server for proxied requests'"upstream_connect_time": "$upstream_connect_time", ' # upstream handshake time incl. TLS'"upstream_header_time": "$upstream_header_time", ' # time spent receiving upstream headers'"upstream_response_time": "$upstream_response_time", ' # time spend receiving upstream body'"upstream_response_length": "$upstream_response_length", ' # upstream response length'"upstream_cache_status": "$upstream_cache_status", ' # cache HIT/MISS where applicable'"ssl_protocol": "$ssl_protocol", ' # TLS protocol'"ssl_cipher": "$ssl_cipher", ' # TLS cipher'"scheme": "$scheme", ' # http or https'"request_method": "$request_method", ' # request method'"server_protocol": "$server_protocol", ' # request protocol, like HTTP/1.1 or HTTP/2.0'"pipe": "$pipe", ' # "p" if request was pipelined, "." otherwise'"gzip_ratio": "$gzip_ratio", ''"http_cf_ray": "$http_cf_ray",'# '"http_authorization": "$http_authorization", ' # 添加 Authorization 头信息 # added by Rubin @2025/4/6 '"geoip_country_code": ""' # "$geoip_country_code"'}';# 日志配置(按天生成日誌文件名)map $time_iso8601 $logdate {'~^(?<ymd>\d{4}-\d{2}-\d{2})' $ymd;default 'date-not-found';}# access_log /var/log/nginx/access.log;access_log /var/log/nginx/access_$logdate.log json_analytics;error_log /var/log/nginx/error.log warn;# 简单的HTTP服务器设置server {listen       80;  # 监听80端口# 请求根目录时返回的内容location / {root   /usr/share/nginx/html;  # 网页所在目录index  index.html;   # 默认主页}error_page 404  /index.html;# 错误页面设置error_page  500 502 503 504  /50x.html;location = /50x.html {root   /usr/share/nginx/html;}}# Optionally, enable gzip for all server blocksgzip  on;
}
8.docker-compose.yml
# version: "3.8"services:# OTEL Collector to receive logs, metrics and traces from the applicationotel-collector:#image: otel/opentelemetry-collector:0.123.0 # no loki exporterimage: otel/opentelemetry-collector-contrib:0.123.0container_name: otel-collectorcommand: [ "--config=/etc/otel-collector.yaml" ]volumes:- ./otel-collector.yaml:/etc/otel-collector.yamlports:- "4317:4317"- "4318:4318"- "9201:9201"networks:- my_network# Exports Traces to Tempotempo:image: grafana/tempo:2.7.2container_name: tempocommand: [ "-config.file=/etc/tempo.yaml" ]volumes:- ./tempo.yaml:/etc/tempo.yaml- ./tempo-data:/tmp/tempoports:- "3200" # tempo- "4317" # otlp grpc- "4318" # otlp httpnetworks:- my_network# Loki for log managementloki:image: grafana/loki:3.4.3container_name: lokicommand: [ "-config.file=/etc/loki.yaml" ]volumes:- ./loki.yaml:/etc/loki.yaml- ./loki-data:/tmp/lokiports:- "3100"networks:- my_network# Exports Metrics to Prometheusprometheus:image: prom/prometheus:3.3.0container_name: prometheuscommand:- --config.file=/etc/prometheus.yaml- --web.enable-remote-write-receiver- --enable-feature=exemplar-storagevolumes:- ./prometheus.yaml:/etc/prometheus.yaml- ./prometheus-data:/prometheusports:- "9090:9090"networks:- my_network# UI to query traces, metrics and logsgrafana:image: grafana/grafana:11.1.0container_name: grafanavolumes:- ./grafana-datasources.yaml:/etc/grafana/provisioning/datasources/datasources.yaml- ./grafana-data:/var/lib/grafanaenvironment:- GF_AUTH_ANONYMOUS_ENABLED=true- GF_AUTH_ANONYMOUS_ORG_ROLE=Editor # Admin Viewer Editor- GF_AUTH_DISABLE_LOGIN_FORM=false # true- GF_FEATURE_TOGGLES_ENABLE=traceqlEditor- http_proxy=ports:- "3000:3000"networks:- my_networkpromtail:image: grafana/promtail:3.4.2container_name: promtailcommand: [ "-config.file=/etc/promtail/config.yaml" ]volumes:- ./promtail-config.yaml:/etc/promtail/config.yaml- ./nginx-data/logs:/var/log/nginx- ./promtail-data:/run/promtailports:- "9080:9080"networks:- my_networknginx:image: your/nginx:1.0.11container_name: nginxvolumes:- ./nginx-custom.conf:/etc/nginx/nginx.conf- ./nginx-data/logs:/var/log/nginx # mount a folder for logs- ./nginx-data/logs:/etc/nginx/html # ports:- "8002:80"networks:- my_networknetworks:my_network:driver: bridge
三、Docker run
1.start.sh
docker-compose up -d2.stop.sh
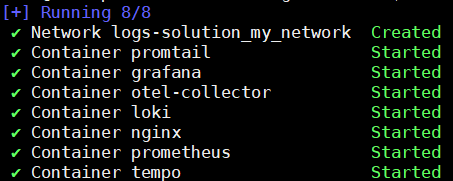
docker-compose down3.Run ./start.sh
四、Reference
Quick start | OpenTelemetry
https://github.com/open-telemetry/opentelemetry-dotnet/blob/main/examples/AspNetCore/docker-compose.yaml
总结
此篇文章分享了Observability(可观测性)环境的安装过程,下一篇将分享.NET程式如何把Traces, Metrics, Logs发送给opentelemetry-collector。