JFreeChart 使用介绍
URL:http://www.huosen.net/archives/156.html
一、简介
JFreeChart是JAVA平台上的一个开放的图表绘制类库。它完全使用JAVA语言编写,是为applications, applets, servlets 以及JSP等使用所设计。
JFreeChart可生成饼图(pie charts)、柱状图(bar charts)、散点图(scatter plots)、时序图(time series)、甘特图(Gantt charts)等等多种图表,并且可以产生PNG和JPEG格式的输出,还可以与PDF和EXCEL关联。
二、下载安装
1 相关网址:
- 官方网址 http://www.jfree.org
- 官方文档 http://www.jfree.org/jfreechart/api/javadoc/index.html
- 官方下载 http://www.jfree.org/jfreechart/download.html
2 所需jar包:
- 解压jfreechart-1.0.14.zip,并打开lib文件夹;
- 将jfreechart-1.0.14.jar、jcommon-1.0.17.jar导入自己的工程当中;
三、配置使用:
下面介绍生成柱状图、饼图、折线图的简单生成方式及生成的图的展现方式,如:图片文件、jsp页面。
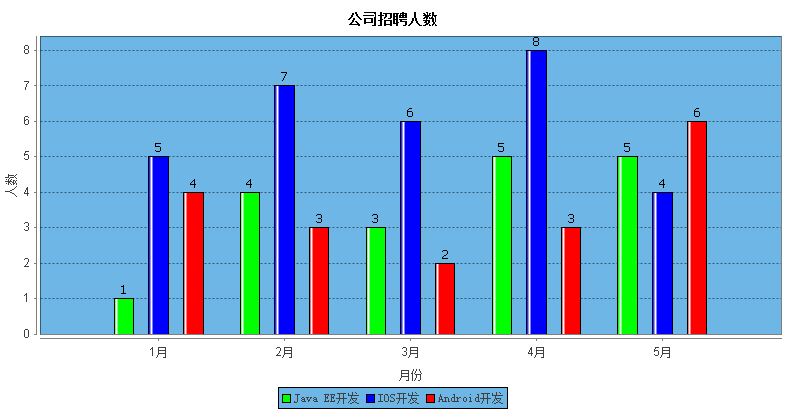
下边的方法为生成柱状图的方法:
/*** 创建柱状图* @param chartTitle 图表标题* @param xName      x轴标题* @param yName      y轴标题* @param dataset    数据集* @return*/
public static JFreeChart createChart(String chartTitle, String xName,String yName, CategoryDataset dataset) {/*** createBarChart的参数分别为:* 标题,横坐标标题,纵坐标标题,数据集,图标方向(水平、垂直)* ,是否显示图例,是否显示tooltips,是否urls*/JFreeChart chart = ChartFactory.createBarChart(chartTitle, xName, yName,dataset, PlotOrientation.VERTICAL,true, true, false);/*** VALUE_TEXT_ANTIALIAS_OFF表示将文字的抗锯齿关闭,* 使用的关闭抗锯齿后,字体尽量选择12到14号的宋体字,这样文字最清晰好看*/chart.getRenderingHints().put(RenderingHints.KEY_TEXT_ANTIALIASING,RenderingHints.VALUE_TEXT_ANTIALIAS_OFF);// 背景色chart.setBackgroundPaint(Color.white);// 设置标题字体chart.getTitle().setFont(new Font("宋体", Font.BOLD, 14));// 图例背景色chart.getLegend().setBackgroundPaint(new Color(110, 182, 229));// 图例字体chart.getLegend().setItemFont(new Font("宋体", Font.PLAIN, 12));CategoryPlot categoryPlot = (CategoryPlot) chart.getPlot();// 设置纵虚线可见//categoryPlot.setDomainGridlinesVisible(true);// 虚线色彩//categoryPlot.setDomainGridlinePaint(Color.black);// 设置横虚线可见categoryPlot.setRangeGridlinesVisible(true);// 虚线色彩categoryPlot.setRangeGridlinePaint(Color.black);// 设置柱的透明度categoryPlot.setForegroundAlpha(1.0f);//设置柱图背景色(注意,系统取色的时候要使用//16位的模式来查看颜色编码,这样比较准确)categoryPlot.setBackgroundPaint(new Color(110, 182, 229));/** categoryPlot.setRangeCrosshairVisible(true);* categoryPlot.setRangeCrosshairPaint(Color.blue);*/// 纵坐标--范围轴NumberAxis numberAxis = (NumberAxis) categoryPlot.getRangeAxis();// 纵坐标y轴坐标字体numberAxis.setTickLabelFont(new Font("sans-serif", Font.PLAIN, 12));// 纵坐标y轴标题字体numberAxis.setLabelFont(new Font("宋体", Font.PLAIN, 12));// 设置最高的一个 Item 与图片顶端的距离// numberAxis.setUpperMargin(0.5);// 设置最低的一个 Item 与图片底端的距离// numberAxis.setLowerMargin(0.5);// 设置刻度单位 为IntegernumberAxis.setStandardTickUnits(NumberAxis.createIntegerTickUnits());// 横坐标--类别轴、域CategoryAxis categoryAxis = categoryPlot.getDomainAxis();// 横坐标x轴坐标字体categoryAxis.setTickLabelFont(new Font("sans-serif", Font.PLAIN, 12));// 横坐标x轴标题字体categoryAxis.setLabelFont(new Font("宋体", Font.PLAIN, 12));// 类别轴的位置,倾斜度categoryAxis.setCategoryLabelPositions(CategoryLabelPositions.createUpRotationLabelPositions(0.5235987755982988D));//横轴上的 Lable//categoryAxis.setMaximumCategoryLabelWidthRatio(0.6f);//是否完整显示//设置距离图片左端距离categoryAxis.setLowerMargin(0.1D);// 设置距离图片右端距离categoryAxis.setUpperMargin(0.1D);// 渲染 - 中间的部分BarRenderer barRenderer = (BarRenderer) categoryPlot.getRenderer();// 设置柱子宽度barRenderer.setMaximumBarWidth(0.05);// 设置柱子高度barRenderer.setMinimumBarLength(0.2);// 设置柱子边框颜色barRenderer.setBaseOutlinePaint(Color.BLACK);// 设置柱子边框可见barRenderer.setDrawBarOutline(true);// 设置柱的颜色barRenderer.setSeriesPaint(0, new Color(0, 255, 0));barRenderer.setSeriesPaint(1, new Color(0, 0, 255));barRenderer.setSeriesPaint(2, new Color(255, 0, 0));// 设置每个柱之间距离barRenderer.setItemMargin(0.2D);// 显示每个柱的数值,并修改该数值的字体属性barRenderer.setIncludeBaseInRange(true);barRenderer.setBaseItemLabelGenerator(new StandardCategoryItemLabelGenerator());barRenderer.setBaseItemLabelsVisible(true);return chart;
}
柱状图的数据集:
/*** 柱状图数据集** @return*/
public static CategoryDataset createDataset() {String str1 = "Java EE开发";String str2 = "IOS开发";String str3 = "Android开发";String str4 = "1月";String str5 = "2月";String str6 = "3月";String str7 = "4月";String str8 = "5月";DefaultCategoryDataset dataset = new DefaultCategoryDataset();dataset.addValue(1.0D, str1, str4);dataset.addValue(4.0D, str1, str5);dataset.addValue(3.0D, str1, str6);dataset.addValue(5.0D, str1, str7);dataset.addValue(5.0D, str1, str8);dataset.addValue(5.0D, str2, str4);dataset.addValue(7.0D, str2, str5);dataset.addValue(6.0D, str2, str6);dataset.addValue(8.0D, str2, str7);dataset.addValue(4.0D, str2, str8);dataset.addValue(4.0D, str3, str4);dataset.addValue(3.0D, str3, str5);dataset.addValue(2.0D, str3, str6);dataset.addValue(3.0D, str3, str7);dataset.addValue(6.0D, str3, str8);return dataset;
}
2 饼图:
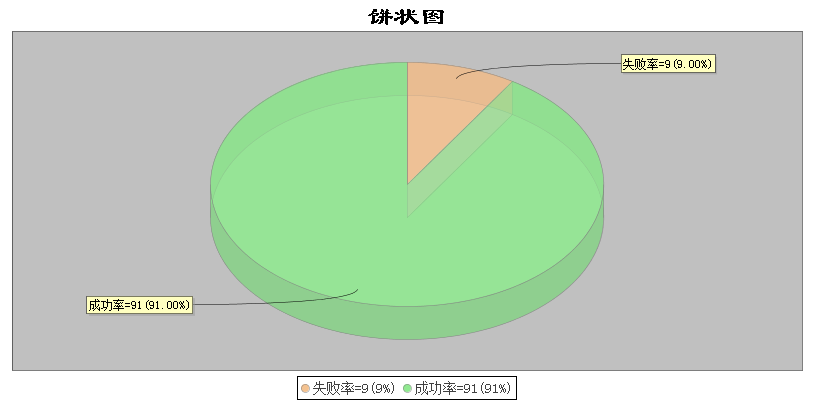
下边为饼图的生成方法和数据的生成方式:
/*** 生成饼图* @param chartTitle 图的标题* @param dataset 数据集* @param pieKeys 分饼的名字集* @return*/
public static JFreeChart createPieChart3D(String chartTitle,PieDataset dataset,String[] pieKeys) {JFreeChart chart = ChartFactory.createPieChart3D(chartTitle,dataset,true,//显示图例true,false);//关闭抗锯齿,是字体清晰chart.getRenderingHints().put(RenderingHints.KEY_TEXT_ANTIALIASING,RenderingHints.VALUE_TEXT_ANTIALIAS_OFF);chart.setTextAntiAlias(false);//图片背景色chart.setBackgroundPaint(Color.white);//设置图标题的字体重新设置titleFont font = new Font("隶书", Font.BOLD, 25);chart.getTitle().setFont(font);/*TextTitle title = new TextTitle(chartTitle);title.setFont(font);chart.setTitle(title);*///设置图例字体chart.getLegend().setItemFont(new Font("宋体",Font.PLAIN,14));PiePlot3D plot = (PiePlot3D) chart.getPlot();// 图片中显示百分比:默认方式// 指定饼图轮廓线的颜色// plot.setBaseSectionOutlinePaint(Color.BLACK);// plot.setBaseSectionPaint(Color.BLACK);// 设置无数据时的信息plot.setNoDataMessage("无对应的数据,请重新查询。");// 设置无数据时的信息显示颜色plot.setNoDataMessagePaint(Color.red);// 图片中显示百分比:自定义方式,{0} 表示选项,//{1} 表示数值, {2} 表示所占比例 ,小数点后两位plot.setLabelGenerator(new StandardPieSectionLabelGenerator("{0}={1}({2})", NumberFormat.getNumberInstance(),new DecimalFormat("0.00%")));//图片显示字体plot.setLabelFont(new Font("宋体", Font.TRUETYPE_FONT, 12));// 图例显示百分比:自定义方式, {0} 表示选项,//{1} 表示数值, {2} 表示所占比例plot.setLegendLabelGenerator(new StandardPieSectionLabelGenerator("{0}={1}({2})"));// 指定图片的透明度(0.0-1.0)plot.setForegroundAlpha(0.65f);// 指定显示的饼图上圆形(false)还椭圆形(true)plot.setCircular(false, true);// 设置第一个 饼块section 的开始位置,默认是12点钟方向plot.setStartAngle(90);// // 设置分饼颜色plot.setSectionPaint(pieKeys[0], new Color(244, 194, 144));plot.setSectionPaint(pieKeys[1], new Color(144, 233, 144));return chart;
}
// 饼状图 数据集
public static PieDataset getDataPieSetByUtil(double[] data,String[] datadescription) {if (data != null && datadescription != null) {if (data.length == datadescription.length) {DefaultPieDataset dataset = new DefaultPieDataset();for (int i = 0; i < data.length; i++) {dataset.setValue(datadescription[i], data[i]);}return dataset;}}return null;
}
3 折线图:
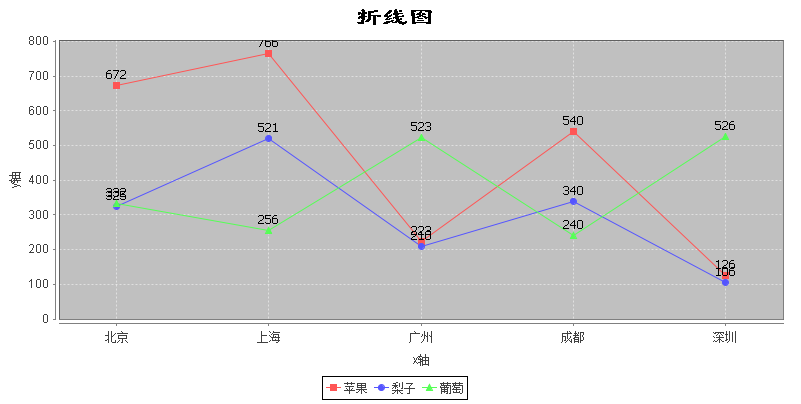
下边为折线图的生成方法,其中,数据集的生成方式和柱状图类似:
/*** 生成折线图* @param chartTitle 图的标题* @param x          横轴标题* @param y          纵轴标题* @param dataset    数据集* @return*/
public static JFreeChart createLineChart(String chartTitle, String x,String y, CategoryDataset dataset) {// 构建一个chartJFreeChart chart = ChartFactory.createLineChart(chartTitle,x,y,dataset,PlotOrientation.VERTICAL,true,true,false);//字体清晰chart.setTextAntiAlias(false);// 设置背景颜色chart.setBackgroundPaint(Color.WHITE);// 设置图标题的字体Font font = new Font("隶书", Font.BOLD, 25);chart.getTitle().setFont(font);// 设置面板字体Font labelFont = new Font("SansSerif", Font.TRUETYPE_FONT, 12);// 设置图示的字体chart.getLegend().setItemFont(labelFont);CategoryPlot categoryplot = (CategoryPlot) chart.getPlot();// x轴 // 分类轴网格是否可见categoryplot.setDomainGridlinesVisible(true);// y轴 //数据轴网格是否可见categoryplot.setRangeGridlinesVisible(true);categoryplot.setRangeGridlinePaint(Color.WHITE);// 虚线色彩categoryplot.setDomainGridlinePaint(Color.WHITE);// 虚线色彩categoryplot.setBackgroundPaint(Color.lightGray);// 折线图的背景颜色// 设置轴和面板之间的距离// categoryplot.setAxisOffset(new RectangleInsets(5D, 5D, 5D, 5D));// 横轴 xCategoryAxis domainAxis = categoryplot.getDomainAxis();domainAxis.setLabelFont(labelFont);// 轴标题domainAxis.setTickLabelFont(labelFont);// 轴数值// domainAxis.setLabelPaint(Color.BLUE);//轴标题的颜色// domainAxis.setTickLabelPaint(Color.BLUE);//轴数值的颜色// 横轴 lable 的位置 横轴上的 Lable 45度倾斜 DOWN_45domainAxis.setCategoryLabelPositions(CategoryLabelPositions.STANDARD);// 设置距离图片左端距离domainAxis.setLowerMargin(0.0);// 设置距离图片右端距离domainAxis.setUpperMargin(0.0);// 纵轴 yNumberAxis numberaxis = (NumberAxis) categoryplot.getRangeAxis();numberaxis.setLabelFont(labelFont);numberaxis.setTickLabelFont(labelFont);numberaxis.setStandardTickUnits(NumberAxis.createIntegerTickUnits());numberaxis.setAutoRangeIncludesZero(true);// 获得renderer 注意这里是下嗍造型到lineandshaperenderer!!LineAndShapeRenderer lineandshaperenderer = (LineAndShapeRenderer) categoryplot.getRenderer();lineandshaperenderer.setBaseShapesVisible(true); // series 点(即数据点)可见lineandshaperenderer.setBaseLinesVisible(true); // series 点(即数据点)间有连线可见// 显示折点数据lineandshaperenderer.setBaseItemLabelGenerator(new StandardCategoryItemLabelGenerator());lineandshaperenderer.setBaseItemLabelsVisible(true);return chart;
}
4 图表的显示方式:
我总结了三种使用情况,分别为:
①生成图片到指定目录的方式;
②在servlet中使用,并在jsp页面中显示图片;
③在struts2中使用,并在jsp页面中显示图片;
第一种
第一种为生成指定的图片到指定的目录
需要用到ChartUtilities类的writeChartAsPNG方法,具体使用方式如下:
FileOutputStream fosChart = null;
try {//文件夹不存在则创建File file = new File(CHART_PATH);if (!file.exists()) {file.mkdirs();}String chartName = CHART_PATH + charName;fosChart = new FileOutputStream(chartName);//高宽的设置影响椭圆饼图的形状ChartUtilities.writeChartAsPNG(fosChart, chart, 500, 230);return chartName;
} catch (Exception e) {e.printStackTrace();
} finally {try {fosChart.close();} catch (Exception e) {e.printStackTrace();}
}
其中,CHART_PATH为文件路径,charName为生成图的名称
第二种
第二种为在servlet中使用,需要配置servlet,生成的图片会自动存放至tomcat服务器的temp临时文件夹下,具体如下:
首先配置访问图片的servlet的请求:
<!-- 配置jfreechart 的servlet,用来访问图片的请求 web.xml-->
<servlet><servlet-name>DisplayChart</servlet-name><servlet-class>org.jfree.chart.servlet.DisplayChart</servlet-class>
</servlet>
<servlet-mapping><servlet-name>DisplayChart</servlet-name><url-pattern>/DisplayChart</url-pattern>
</servlet-mapping> 第三种 第三种是在struts2中使用jfreechart,需要添加在struts2中添加jfreechart支持,即添加struts2-jfreechart-plugin-2.3.1.2.jar
最后,需要在Action的某方法中,给JFreeChart对象赋值,并实现get方法,即可通过页面访问该action得到图片。
源码地址:https://github.com/huozhicheng/JFreeChart 我的相关资源已经上传到:http://download.csdn.net/detail/cxc19890214/7900073 |