CT三视图显示及插值切片显示-全网独家(复制即用)
首先主题部分借鉴于下面大佬的代码
利用Python绘制 CT三视图 - 知乎
我在上述代码中优化了一部分插值切片,实现了功能:
显示两个切片之间的图像信息
1、import 头文件
import numpy as np
import pydicom
import os
import matplotlib.pyplot as plt
from scipy import ndimage
import cv2
2、三个核心函数
def load_scan(path):temp = [pydicom.dcmread(path + f) for f in os.listdir(path)]slices = [t for t in temp if t.Modality == 'CT']# 修改排序方式,确保从下到上的正确顺序slices.sort(key=lambda x: -float(x.ImagePositionPatient[2]))  # 使用负号确保从下到上try:slice_thickness = np.abs(slices[0].ImagePositionPatient[2] - slices[1].ImagePositionPatient[2])except:slice_thickness = np.abs(slices[0].SliceLocation - slices[1].SliceLocation)      for s in slices:s.SliceThickness = slice_thickness        return slicesdef get_pixels_hu(scans):image = np.stack([s.pixel_array for s in scans]) image = image.astype(np.int16)# Convert to Hounsfield units (HU)intercept = scans[0].RescaleInterceptslope = scans[0].RescaleSlopeif slope != 1:image = slope * image.astype(np.float64)image = image.astype(np.int16)image += np.int16(intercept)return np.array(image, dtype=np.int16)
def get_interpolated_slice(volume, position, axis=0):"""获取插值后的切片:param volume: 3D体数据:param position: 切片位置(浮点数):param axis: 插值轴 (0=axial, 1=coronal, 2=sagittal)"""# 获取相邻切片lower = int(np.floor(position))upper = int(np.ceil(position))# 边界检查lower = max(0, min(lower, volume.shape[axis]-1))upper = max(0, min(upper, volume.shape[axis]-1))# 线性插值if lower == upper:if axis == 0:return volume[lower, :, :]elif axis == 1:return volume[:, lower, :]else:return volume[:, :, lower]else:alpha = position - lowerif axis == 0:lower_slice = volume[lower, :, :]upper_slice = volume[upper, :, :]elif axis == 1:lower_slice = volume[:, lower, :]upper_slice = volume[:, upper, :]else:lower_slice = volume[:, :, lower]upper_slice = volume[:, :, upper]return (1-alpha)*lower_slice + alpha*upper_slice
3、图像采集与初始化参数
该部分进行小小的调整,原作者矢状面显示是横着的,我显示的是与3dslicer显示的一致
重点:
pydicom和3dslicer切片的顺序是正好相反的
dir_path_ct = r'C:\Desktop\ct_seg\dicom_data\\'
patient = load_scan(dir_path_ct)
imgs_ct = get_pixels_hu(patient)
# pixel aspects, assuming all slices are the same
ps = patient[0].PixelSpacing
ss = patient[0].SliceThickness
ax_aspect = ps[1]/ps[0]
sag_aspect = ss/ps[1]
cor_aspect = ss/ps[0]
注意:这里面的路径最后面要有斜杠,或者调整一下代码
4、显示插值切片(提供浮点数切片位置)
position = 255.5
interp_slice = get_interpolated_slice(imgs_ct, position, axis=1)# 归一化到0-255范围
interp_slice = cv2.normalize(interp_slice, None, 0, 255, cv2.NORM_MINMAX).astype(np.uint8)# 计算显示窗口大小,保持正确比例
height, width = interp_slice.shape
aspect_ratio = ss/ps[0]  # 使用轴状面比例
height = int(height * aspect_ratio)# 调整图像大小保持比例
resized_img = cv2.resize(interp_slice, (width, height))
# 使用OpenCV显示
cv2.imshow('Interpolated Slice', resized_img)
cv2.waitKey(0)
5、显示三视图+插值切片
# 设置各视图的切片位置参数
# axial_slice = len(patient)//3    # 轴状面切片位置
axial_slice = 39
sagittal_slice = patient[0].pixel_array.shape[1]//2  # 矢状面切片位置
coronal_slice = patient[0].pixel_array.shape[0]//2   # 冠状面切片位置# plot 4 orthogonal slices
plt.figure(figsize=(12, 10))# 轴状面
a1 = plt.subplot(2, 2, 1)
plt.imshow(imgs_ct[axial_slice, :, :], cmap='gray')
a1.set_aspect(ax_aspect)
plt.title(f'Axial Slice {axial_slice}')# 矢状面
a2 = plt.subplot(2, 2, 2)
plt.imshow(imgs_ct[:,:,sagittal_slice], cmap='gray')
a2.set_aspect(sag_aspect)
plt.title(f'Sagittal Slice {sagittal_slice}')# 冠状面
a3 = plt.subplot(2, 2, 3)
plt.imshow(imgs_ct[:, coronal_slice, :], cmap='gray')
a3.set_aspect(cor_aspect)
plt.title(f'Coronal Slice {coronal_slice}')a4 = plt.subplot(2, 2, 4)
# 获取插值切片
position = 255
interp_slice = get_interpolated_slice(imgs_ct, position, axis=1)
# 归一化到0-255范围
interp_slice = cv2.normalize(interp_slice, None, 0, 255, cv2.NORM_MINMAX).astype(np.uint8)plt.imshow(interp_slice, cmap='gray')
a4.set_aspect(sag_aspect)
plt.title(f'Interpolated Slice at {position}')plt.tight_layout(rect=[0, 0.03, 1, 0.9])
plt.show()
效果图显示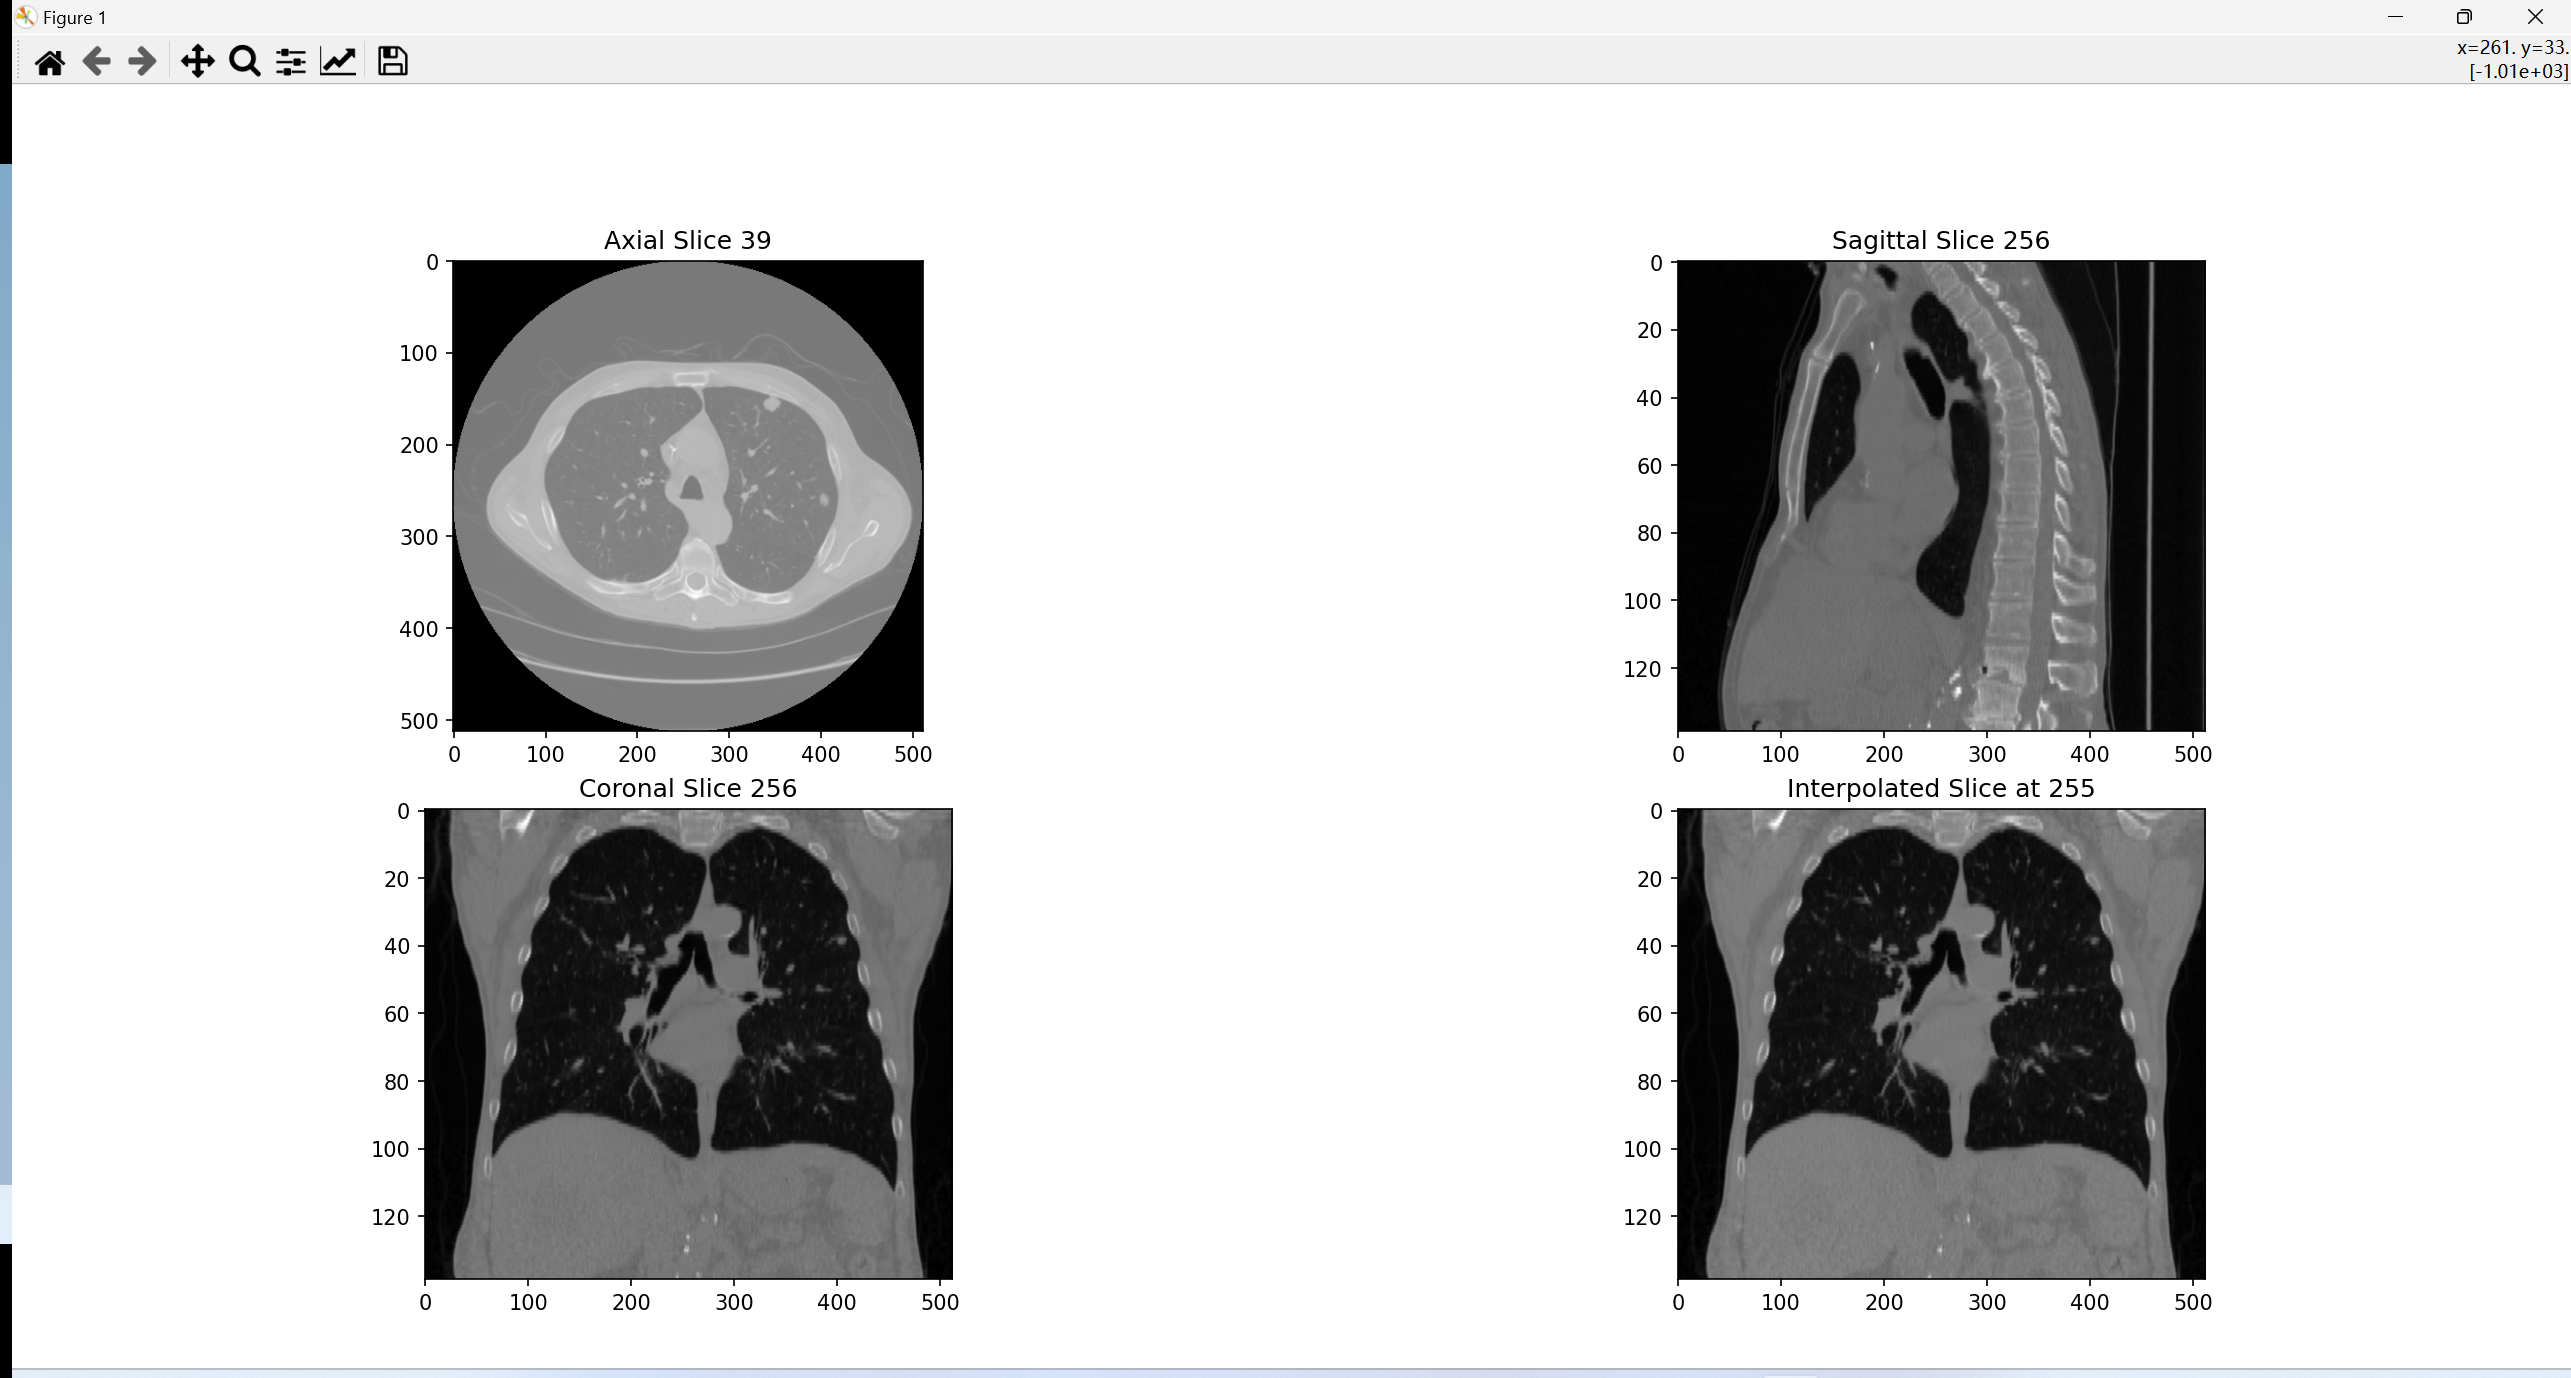
为了朋友的方便性,下面我插入完整代码
import numpy as np
import pydicom
import os
import matplotlib.pyplot as plt
from scipy import ndimage
import cv2def load_scan(path):temp = [pydicom.dcmread(path + f) for f in os.listdir(path)]slices = [t for t in temp if t.Modality == 'CT']# 修改排序方式,确保从下到上的正确顺序slices.sort(key=lambda x: -float(x.ImagePositionPatient[2]))  # 使用负号确保从下到上try:slice_thickness = np.abs(slices[0].ImagePositionPatient[2] - slices[1].ImagePositionPatient[2])except:slice_thickness = np.abs(slices[0].SliceLocation - slices[1].SliceLocation)      for s in slices:s.SliceThickness = slice_thickness        return slicesdef get_pixels_hu(scans):image = np.stack([s.pixel_array for s in scans]) image = image.astype(np.int16)# Convert to Hounsfield units (HU)intercept = scans[0].RescaleInterceptslope = scans[0].RescaleSlopeif slope != 1:image = slope * image.astype(np.float64)image = image.astype(np.int16)image += np.int16(intercept)return np.array(image, dtype=np.int16)
def get_interpolated_slice(volume, position, axis=0):"""获取插值后的切片:param volume: 3D体数据:param position: 切片位置(浮点数):param axis: 插值轴 (0=axial, 1=coronal, 2=sagittal)"""# 获取相邻切片lower = int(np.floor(position))upper = int(np.ceil(position))# 边界检查lower = max(0, min(lower, volume.shape[axis]-1))upper = max(0, min(upper, volume.shape[axis]-1))# 线性插值if lower == upper:if axis == 0:return volume[lower, :, :]elif axis == 1:return volume[:, lower, :]else:return volume[:, :, lower]else:alpha = position - lowerif axis == 0:lower_slice = volume[lower, :, :]upper_slice = volume[upper, :, :]elif axis == 1:lower_slice = volume[:, lower, :]upper_slice = volume[:, upper, :]else:lower_slice = volume[:, :, lower]upper_slice = volume[:, :, upper]return (1-alpha)*lower_slice + alpha*upper_slice# open CT_lung dataset
dir_path_ct = r'D:\DICOM1\\'
patient = load_scan(dir_path_ct)
imgs_ct = get_pixels_hu(patient)
# pixel aspects, assuming all slices are the same
ps = patient[0].PixelSpacing
ss = patient[0].SliceThickness
print(ps, ss)
ax_aspect = ps[1]/ps[0]
sag_aspect = ss/ps[1]
cor_aspect = ss/ps[0]# 设置各视图的切片位置参数
# axial_slice = len(patient)//3    # 轴状面切片位置
axial_slice = 39
sagittal_slice = patient[0].pixel_array.shape[1]//2  # 矢状面切片位置
coronal_slice = patient[0].pixel_array.shape[0]//2   # 冠状面切片位置# plot 4 orthogonal slices
plt.figure(figsize=(12, 10))# 轴状面
a1 = plt.subplot(2, 2, 1)
plt.imshow(imgs_ct[axial_slice, :, :], cmap='gray')
a1.set_aspect(ax_aspect)
plt.title(f'Axial Slice {axial_slice}')# 矢状面
a2 = plt.subplot(2, 2, 2)
plt.imshow(imgs_ct[:,:,sagittal_slice], cmap='gray')
a2.set_aspect(sag_aspect)
plt.title(f'Sagittal Slice {sagittal_slice}')# 冠状面
a3 = plt.subplot(2, 2, 3)
plt.imshow(imgs_ct[:, coronal_slice, :], cmap='gray')
a3.set_aspect(cor_aspect)
plt.title(f'Coronal Slice {coronal_slice}')a4 = plt.subplot(2, 2, 4)
# 获取插值切片
position = 255
interp_slice = get_interpolated_slice(imgs_ct, position, axis=1)
# 归一化到0-255范围
interp_slice = cv2.normalize(interp_slice, None, 0, 255, cv2.NORM_MINMAX).astype(np.uint8)plt.imshow(interp_slice, cmap='gray')
a4.set_aspect(sag_aspect)
plt.title(f'Interpolated Slice at {position}')plt.tight_layout(rect=[0, 0.03, 1, 0.9])
plt.show()
如果有相关问题,可以关注,发私信,希望找到志同道合的朋友们!