2025年数维杯C题完整求解思路讲解+代码分享
C 题清明时节雨纷纷,何处踏青不误春?
本文将详细的为大家带来C题的超详细解题思路。具体分为三个部分
l明确降雨的分类标准和区间,分析2026年不同地区的降雨情况。
l建立花卉开放的预报模型,预测杏花、油菜花、杜鹃花等花卉的花期。
l制定具体的旅游策略,延长赏花的经济效益。
首先,进行数据预处理工作。
通过网盘分享的文件:分享数据集
链接: https://pan.baidu.com/s/1PNIsWAuvC7gSyySv7kx4wQ 提取码: 4evx
对于问题一数据集,
数据主要来源为题目给出第二个网站
天气网提供从1981 年起世界 241 个国家的历史天气信息和最新天气预报。站点数据库的数据每三小时记录一次,每天八次。网址为: https://rp5.ru/。网站使用说明见文末
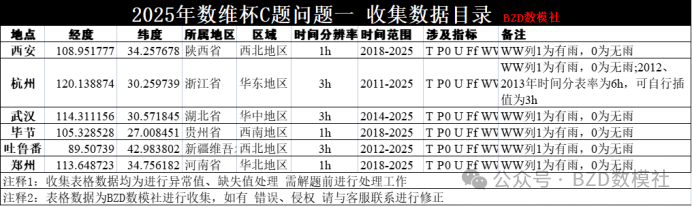
在网站首页查找本题所需要研究的城市即可。对于问题一要求的西安、吐鲁番、婺源、杭州、毕节、武汉、洛阳。由于气象网站问题,七个城市中婺源、毕节、洛阳均无法直接搜索。这里我们可选择接邻的城市进行平替,网站中对于洛阳的历史天气会直接输出郑州历史天气。我们也可以使用网站中存在的景德镇数据替代婺源,贵阳数据替代毕节。对于下载的数据,是近十年逐小时或者3小时分辨率的数据。我们还需要对数据进行一定的数据清洗。
基于题目研究的清明节天气,并让我们适当简化模型。这里我们初步构想为使用过去十年的清明节当天的天气预测2026年的天气。因此需要进行数据筛选。对于清明节的定义为春分后15天,并非指定的4.4.下表为近十年的清明节具体时间
| 年份 | 具体时间 | 年份 | 具体时间 |
| 2000年 | 4月4日 | 2014年 | 4月5日 |
| 2001年 | 4月5日 | 2015年 | 4月5日 |
| 2002年 | 4月5日 | 2016年 | 4月4日 |
| 2003年 | 4月5日 | 2017年 | 4月4日 |
| 2004年 | 4月4日 | 2018年 | 4月5日 |
| 2005年 | 4月5日 | 2019年 | 4月5日 |
| 2006年 | 4月5日 | 2020年 | 4月4日 |
| 2007年 | 4月5日 | 2021年 | 4月4日 |
| 2008年 | 4月4日 | 2022年 | 4月5日 |
| 2009年 | 4月4日 | 2023年 | 4月5日 |
| 2010年 | 4月5日 | 2024年 | 4月4日 |
| 2011年 | 4月5日 | 2025年 | 4月4日 |
| 2012年 | 4月4日 | 2026年 | 4月5日 |
基于改时间点对收集的数据进行筛选即可。
筛选中存在一定的问题
1、对于杭州数据;2012、2013年时间分表率为6h,可自行插值为3h与后续年份统一
2、对于各种指标的选择(T P0 U Ff WW VV)可根据自己模型需要进行选择
3、表格中存在很多的文字信息,为了方便后续处理应该进行一定的转码处理
对于问题二数据集,
基于题目给出的文献以及以(‘***花期预报’)进行知网搜索的文献对文献中的研究地区以及记录数据进行爬取。
下面进行必要的数据清洗工作。
我们以毕节为例,
| 当毕节时间 | T | P0 | U | Ff | WW | VV |
| 05.04.2023 19:00 | 13.0 | 655.9 | 77 | 6 | 0 | 10 |
| 05.04.2023 20:00 | 12.0 | 655.6 | 82 | 5 | 0 | 10 |
| 05.04.2023 21:00 | 11.0 | 656.5 | 82 | 5 | 0 | 10 |
| 05.04.2023 22:00 | 10.0 | 656.8 | 94 | 5 | 1 | 8 |
| 05.04.2023 23:00 | 0 | |||||
| 04.04.2024 00:00 | 17.0 | 657.8 | 77 | 4 | 0 | 10 |
| 04.04.2024 01:00 | 17.0 | 657.2 | 77 | 3 | 0 | 10 |
| 04.04.2024 02:00 | 15.0 | 656.6 | 88 | 4 | 0 | 10 |
| 04.04.2024 03:00 | 15.0 | 656.6 | 82 | 4 | 0 | 10 |
| 04.04.2024 04:00 | 14.0 | 656.2 | 94 | 4 | 1 | 10 |
| 04.04.2024 05:00 | 14.0 | 656.2 | 94 | 4 | 1 | 10 |
我们分别使用线性、样条、PCHIP、最近邻插值进行插值补充数据,并根据插值结果选择插值效果最好的模型进行补充数据。
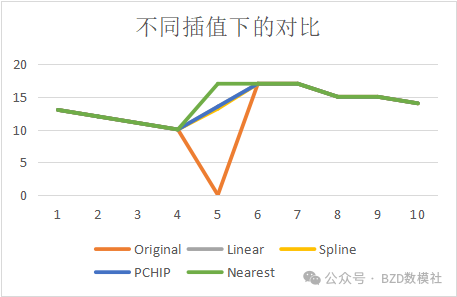
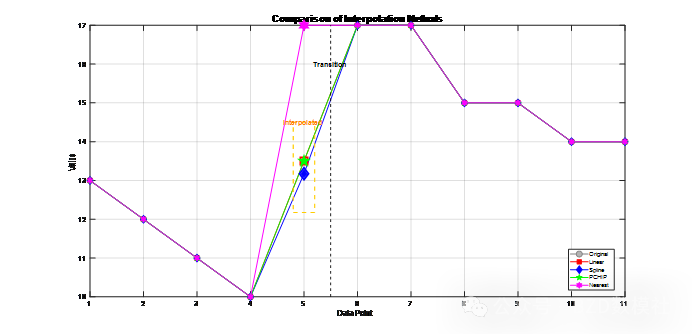
对于收集的数据,由于真实情况、记录问题等不可避免因素。记录数据存在缺失值,可以使用插值模型进行填充。
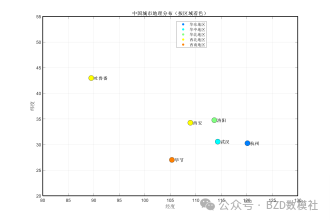
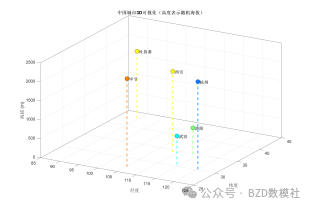
同时,对于研究的西安、吐鲁番、婺源、杭州、毕节、武汉、洛阳几个城市也可以根据地理位置绘制可视化结果进行表述
问题一、基于天气现象分类标准, 明确“ 雨纷纷” 对应的降雨量区间及降雨持续时间范围。根据天气学的基本知识, 在适当简化的基础上, 建立数学模型,分析 2026 年清明假期西安、吐鲁番、婺源、杭州、毕节、武汉、洛阳会“ 雨纷纷” 吗? 利用近 20 年的天气资料分析 2025 年清明的天气情况, 验证所建模型的合理性。给出利用最新的天气实况进行模型修正的方法
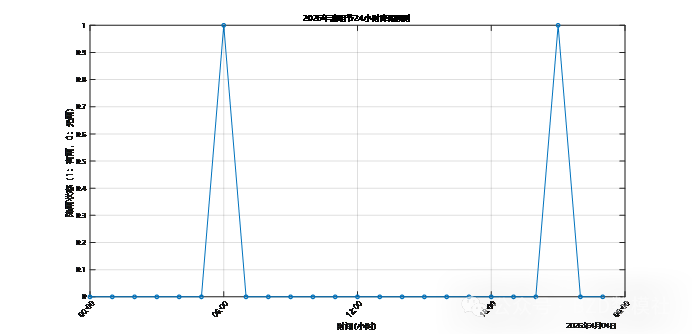
对于问题一,本质问题一是判定2026年清明节的下雨状态。我们的目标是根据一组气象数据(包括大气温度T、气压P0、相对湿度U、风速FF等)建立一个分类模型,用于判定清明节当天是否下雨。该分类模型的输出是一个二元变量(WW列),1表示有雨,0表示无雨。
我们以西安为例,输入数据来源于2018年至2025年每年清明节当天的24小时气象数据,预测2026年清明节当天的24小时是否下雨。
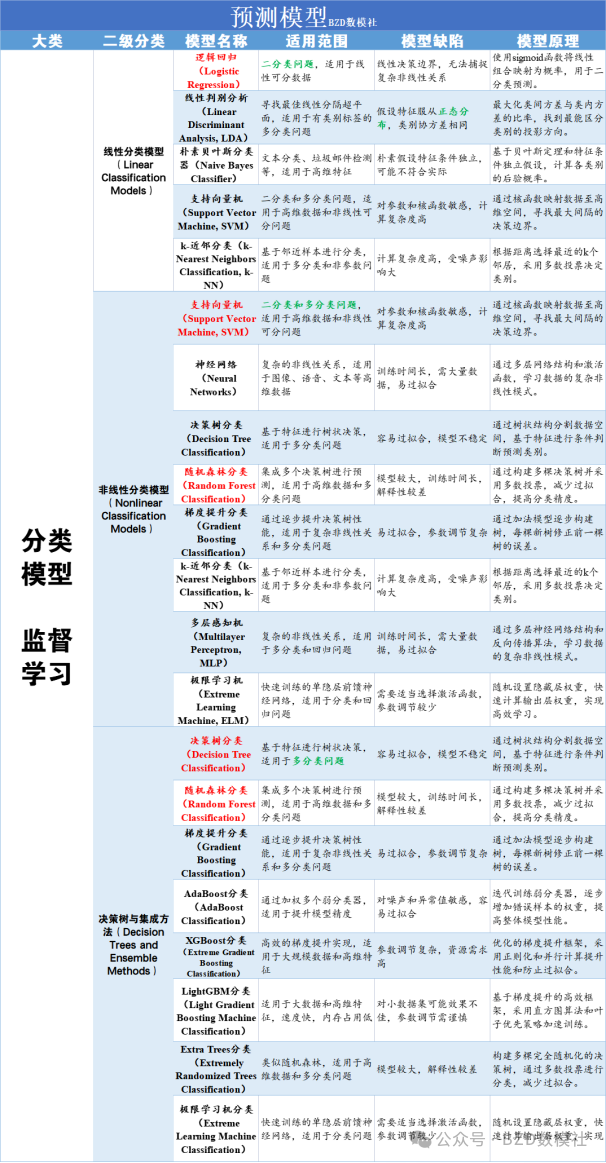
本问题是一个二分类问题,可以选择如随机森林、梯度提升树(XGBoost、LightGBM等)、支持向量机(SVM)等传统机器学习模型进行建模。也可以尝试深度学习模型,如LSTM(长短期记忆网络),它能处理时间序列数据中的时间依赖性。具体可选择模型以及模型优缺点可见文末表格
y=f(x1,x2,x3)
训练与验证:使用2018年至2025年的数据进行训练和验证。可以采用交叉验证来评估模型的性能,并调整模型的超参数。
评估指标:在评估模型时,可以使用准确率(accuracy)、精确率(precision)、召回率(recall)和F1分数等指标,特别是在样本不平衡的情况下,F1分数是一个重要的衡量标准。
我们首先以随机森林为例进行展示
Confusion Matrix:
36 0
0 2
Accuracy: 1
Precision: 1
Recall: 1
F1 Score: 1
| 以下为py代码 可以运行出图 | 以下为maltab代码 可以运行出图 |
| import pandas as pd import numpy as np import matplotlib.pyplot as plt import matplotlib.dates as mdates from datetime import datetime, timedelta from sklearn.ensemble import RandomForestClassifier from sklearn.metrics import confusion_matrix, accuracy_score, precision_score, recall_score, f1_score from sklearn.model_selection import train_test_split import matplotlib # Set font properties to avoid issues with Chinese characters matplotlib.rcParams['font.sans-serif'] = ['SimHei', 'DejaVu Sans', 'Arial Unicode MS'] matplotlib.rcParams['axes.unicode_minus'] = False #1. Read data data = pd.read_excel('西安.xlsx') # 2. Process time column, convert to datetime format data['time'] = pd.to_datetime(data['time'], format='%d.%m.%Y %H:%M') # 3. Extract features and labels X = data[['T', 'P0', 'U', 'Ff']].values # Features: temperature T, pressure P0, relative humidity U, wind speed Ff y = data['WW'].values # Labels: WW (1 for rain, 0 for no rain) # 4. Split data into training and testing sets (80% training, 20% testing) X_train, X_test, y_train, y_test = train_test_split(X, y, test_size=0.2, random_state=42) # 5. Train Random Forest model model = RandomForestClassifier(n_estimators=100, random_state=42) model.fit(X_train, y_train) # 6. Make predictions y_pred = model.predict(X_test) # 7. Evaluate model performance conf_matrix = confusion_matrix(y_test, y_pred) print('Confusion Matrix:') print(conf_matrix) # Calculate accuracy accuracy = accuracy_score(y_test, y_pred) print(f'Accuracy: {accuracy:.4f}') # Calculate precision, recall and F1 score precision = precision_score(y_test, y_pred, zero_division=0) recall = recall_score(y_test, y_pred, zero_division=0) f1 = f1_score(y_test, y_pred, zero_division=0) print(f'Precision: {precision:.4f}') print(f'Recall: {recall:.4f}') print(f'F1 Score: {f1:.4f}') # Simulate 2026 Qingming Festival meteorological data based on 2018-2025 data # Get statistics from training data X_all = data[['T', 'P0', 'U', 'Ff']].values mean_T = np.mean(X_all[:, 0]) # Mean of temperature T std_T = np.std(X_all[:, 0]) # Standard deviation of temperature T mean_P0 = np.mean(X_all[:, 1]) # Mean of pressure P0 std_P0 = np.std(X_all[:, 1]) # Standard deviation of pressure P0 mean_U = np.mean(X_all[:, 2]) # Mean of humidity U std_U = np.std(X_all[:, 2]) # Standard deviation of humidity U mean_Ff = np.mean(X_all[:, 3]) # Mean of wind speed Ff std_Ff = np.std(X_all[:, 3]) # Standard deviation of wind speed Ff # Generate simulated data for 24 hours of Qingming Festival 2026 n_hours = 24 # 24 hours np.random.seed(42) # For reproducibility # Simulate data using normal distribution sim_T = mean_T + std_T * np.random.randn(n_hours) # Simulated temperature T sim_P0 = mean_P0 + std_P0 * np.random.randn(n_hours) # Simulated pressure P0 sim_U = mean_U + std_U * np.random.randn(n_hours) # Simulated humidity U sim_Ff = mean_Ff + std_Ff * np.random.randn(n_hours) # Simulated wind speed Ff # Combine simulated meteorological data X_2026_sim = np.column_stack((sim_T, sim_P0, sim_U, sim_Ff)) # Use the trained model to predict rainfall for 2026 simulated data y_pred_2026 = model.predict(X_2026_sim) # Generate time series for Qingming Festival 2026 (April 4, 2026, 24 hours) start_time = datetime(2026, 4, 4) time_2026 = [start_time + timedelta(hours=i) for i in range(24)] # Visualize the rainfall prediction for 2026 plt.figure(figsize=(12, 6)) plt.plot(time_2026, y_pred_2026, '-o', linewidth=2, markersize=6) plt.title('Rainfall Prediction for Qingming Festival 2026', fontsize=14) plt.xlabel('Time (hours)', fontsize=12) plt.ylabel('Rainfall Status (1: Rain, 0: No Rain)', fontsize=12) plt.grid(True) # Format the x-axis to show hours plt.gca().xaxis.set_major_formatter(mdates.DateFormatter('%H:%M')) plt.xticks(rotation=45) plt.tight_layout() # Save the figure plt.savefig('rainfall_prediction_2026.png', dpi=300) plt.show() # Additional visualization: Feature importance feature_names = ['Temperature', 'Pressure', 'Humidity', 'Wind Speed'] feature_importance = model.feature_importances_ # Create a bar chart of feature importance plt.figure(figsize=(10, 6)) plt.bar(feature_names, feature_importance) plt.title('Feature Importance for Rainfall Prediction', fontsize=14) plt.xlabel('Features', fontsize=12) plt.ylabel('Importance', fontsize=12) plt.grid(axis='y', linestyle='--', alpha=0.7) plt.tight_layout() # Save the figure plt.savefig('feature_importance.png', dpi=300) plt.show() # Additional visualization: Prediction confidence # Get prediction probabilities for the 2026 data y_prob_2026 = model.predict_proba(X_2026_sim)[:, 1] # Probability of rain plt.figure(figsize=(12, 6)) plt.plot(time_2026, y_prob_2026, '-o', linewidth=2, markersize=6, color='orange') plt.axhline(y=0.5, color='r', linestyle='--', alpha=0.7) plt.title('Rainfall Prediction Probability for Qingming Festival 2026', fontsize=14) plt.xlabel('Time (hours)', fontsize=12) plt.ylabel('Probability of Rain', fontsize=12) plt.grid(True) plt.ylim(0, 1) # Format the x-axis to show hours plt.gca().xaxis.set_major_formatter(mdates.DateFormatter('%H:%M')) plt.xticks(rotation=45) plt.tight_layout() # Save the figure plt.savefig('rainfall_probability_2026.png', dpi=300) plt.show() # Create a more comprehensive visualization combining weather parameters and rain prediction fig, axs = plt.subplots(5, 1, figsize=(14, 15), sharex=True) # Plot temperature axs[0].plot(time_2026, sim_T, '-o', color='red') axs[0].set_ylabel('Temperature (°C)', fontsize=12) axs[0].grid(True) axs[0].set_title('Simulated Weather Parameters and Rainfall Prediction for Qingming Festival 2026', fontsize=14) # Plot pressure axs[1].plot(time_2026, sim_P0, '-o', color='purple') axs[1].set_ylabel('Pressure (hPa)', fontsize=12) axs[1].grid(True) # Plot humidity axs[2].plot(time_2026, sim_U, '-o', color='blue') axs[2].set_ylabel('Humidity (%)', fontsize=12) axs[2].grid(True) # Plot wind speed axs[3].plot(time_2026, sim_Ff, '-o', color='green') axs[3].set_ylabel('Wind Speed (m/s)', fontsize=12) axs[3].grid(True) # Plot rainfall prediction axs[4].bar(time_2026, y_pred_2026, color='gray', alpha=0.7) axs[4].plot(time_2026, y_prob_2026, '-o', color='orange', linewidth=2) axs[4].set_ylabel('Rain Prediction', fontsize=12) axs[4].set_xlabel('Time (hours)', fontsize=12) axs[4].set_ylim(0, 1.1) axs[4].axhline(y=0.5, color='r', linestyle='--', alpha=0.7) axs[4].grid(True) axs[4].legend(['Probability', 'Prediction (0/1)'], loc='upper right') # Format the x-axis to show hours for ax in axs: ax.xaxis.set_major_formatter(mdates.DateFormatter('%H:%M')) plt.xticks(rotation=45) plt.tight_layout() # Save the figure plt.savefig('comprehensive_weather_prediction_2026.png', dpi=300) plt.show() | % 1. 读取数据 data = readtable('西安.xlsx'); % 读取 Excel 数据 % 2. 处理时间列,将其转换为 MATLAB 可处理的日期格式 data.time = datetime(data.time, 'InputFormat', 'dd.MM.yyyy HH:mm'); % 3. 提取特征和标签 X = data{:, {'T', 'P0', 'U', 'Ff'}}; % 特征:温度T,气压P0,相对湿度U,风速Ff y = data.WW; % 标签:WW(1为有雨,0为无雨) % 4. 划分训练集和测试集(80% 训练,20% 测试) cv = cvpartition(length(y), 'HoldOut', 0.2); X_train = X(training(cv), :); y_train = y(training(cv)); X_test = X(test(cv), :); y_test = y(test(cv)); % 5. 使用随机森林进行建模 mdl = fitcensemble(X_train, y_train, 'Method', 'Bag', 'NumLearningCycles', 100, 'Learner', 'Tree'); % 6. 进行预测 y_pred = predict(mdl, X_test); % 7. 评估模型性能(使用混淆矩阵,精度等指标) confMat = confusionmat(y_test, y_pred); % 混淆矩阵 disp('Confusion Matrix:'); disp(confMat); % 计算准确率 accuracy = sum(y_pred == y_test) / length(y_test); disp(['Accuracy: ', num2str(accuracy)]); % 计算精确度,召回率和F1分数 precision = confMat(2, 2) / (confMat(2, 2) + confMat(1, 2)); % 精确度 recall = confMat(2, 2) / (confMat(2, 2) + confMat(2, 1)); % 召回率 f1_score = 2 * (precision * recall) / (precision + recall); % F1分数 disp(['Precision: ', num2str(precision)]); disp(['Recall: ', num2str(recall)]); disp(['F1 Score: ', num2str(f1_score)]); % 假设我们想根据2018-2025年数据模拟2026年的气象数据 % 先获取2018-2025年的数据(训练集的部分) X_train = data{:, {'T', 'P0', 'U', 'Ff'}}; % 特征:温度T,气压P0,相对湿度U,风速Ff % 从训练数据中提取每一列特征的均值和标准差 mean_T = mean(X_train(:, 1)); % 温度T均值 std_T = std(X_train(:, 1)); % 温度T标准差 mean_P0 = mean(X_train(:, 2)); % 气压P0均值 std_P0 = std(X_train(:, 2)); % 气压P0标准差 mean_U = mean(X_train(:, 3)); % 湿度U均值 std_U = std(X_train(:, 3)); % 湿度U标准差 mean_Ff = mean(X_train(:, 4)); % 风速Ff均值 std_Ff = std(X_train(:, 4)); % 风速Ff标准差 % 模拟2026年清明节的24小时气象数据(根据均值和标准差生成) n_hours = 24; % 24小时 % 使用正态分布来模拟数据(这里的模拟假设与历史数据特征一致) sim_T = mean_T + std_T * randn(n_hours, 1); % 模拟温度T sim_P0 = mean_P0 + std_P0 * randn(n_hours, 1); % 模拟气压P0 sim_U = mean_U + std_U * randn(n_hours, 1); % 模拟湿度U sim_Ff = mean_Ff + std_Ff * randn(n_hours, 1); % 模拟风速Ff % 结合模拟的气象数据 X_2026_sim = [sim_T, sim_P0, sim_U, sim_Ff]; % 使用训练好的模型对2026年模拟的气象数据进行降雨预测 y_pred_2026 = predict(mdl, X_2026_sim); % 预测2026年24小时的降雨状态 % 生成时间序列(2026年清明节的24小时) time_2026 = datetime(2026, 4, 4, 0, 0, 0) + hours(0:23); % 从2026年4月4日0点开始,24小时的时间序列 figure; plot(time_2026, y_pred_2026, '-o', 'LineWidth', 2, 'MarkerSize', 6); title('2026年清明节24小时降雨预测', 'FontSize', 14, 'FontName', 'Microsoft YaHei'); % 设置标题字体 xlabel('时间 (小时)', 'FontSize', 12, 'FontName', 'Microsoft YaHei'); % 设置X轴标签字体 ylabel('降雨状态(1:有雨,0:无雨)', 'FontSize', 12, 'FontName', 'Microsoft YaHei'); % 设置Y轴标签字体 grid on; % 美化图表 xtickformat('HH:mm'); % 格式化X轴时间显示 xtickangle(45); % 让X轴的时间标签倾斜45度,便于阅读 set(gca, 'FontSize', 12, 'FontName', 'Microsoft YaHei'); % 设置坐标轴字体 |
问题二、请根据气象学或物候学的知识, 建立杏花、油菜花、杜鹃花、樱花、牡丹中 2-3 种代表性花卉在 2026 年的开放时间、花期等预报模型,预判春花何时开, 为赏花加一道“ 科技保险”。
对于问题二,基于我们收集的数据杏花、油菜花、杜鹃花、樱花、牡丹对应华东地区、华中地区、西南地区、西北地区、华北地的开花时间以及始期。一共25种情况(由于情况过多,我们无法全部收集每种情况对应的环境信息,因此问题二提供数据为单指标数据)需要改进模型可以收集数据,开花时间和花期受到气候条件(如温度、降水、光照等)的影响。因此,可以将气象数据(如温度、降水量等)作为特征加入到模型中。
y=f(x1)
具体对应模型为
由于问题是回归问题(预测开花时间和花期),我们可以使用以下方法来进行建模:
l线性回归:对于花期和始期的预测,线性回归是最简单的回归方法,适合用于数据之间有线性关系的情况。
l决策树回归:决策树回归能够捕捉数据中的非线性关系,且对特征的不同尺度不敏感。
l随机森林回归:随机森林回归是一种基于决策树的集成学习方法,适用于处理复杂的数据集。
l梯度提升树(XGBoost、LightGBM): 这些是强大的集成学习方法,特别适合处理具有复杂关系的数据集。
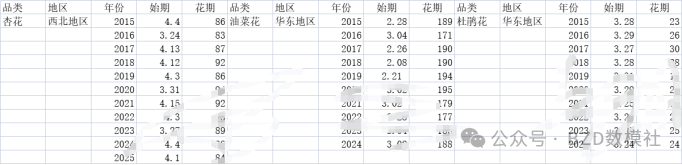
| 品类 | 地区 | |
| 樱花 | 华东地区 | |
| 年份 | 始期 | 花期 |
| 2015 | 2.1 | 32 |
| 2016 | 2.1 | 32 |
| 2017 | 1.23 | 23 |
| 2018 | 2.9 | 40 |
| 2019 | 1.29 | 29 |
| 2020 | 1.19 | 19 |
| 2021 | 1.28 | 28 |
| 2022 | 1.19 | 19 |
| 2023 | 2.12 | 43 |
| 2024 | 2.2 | 33 |
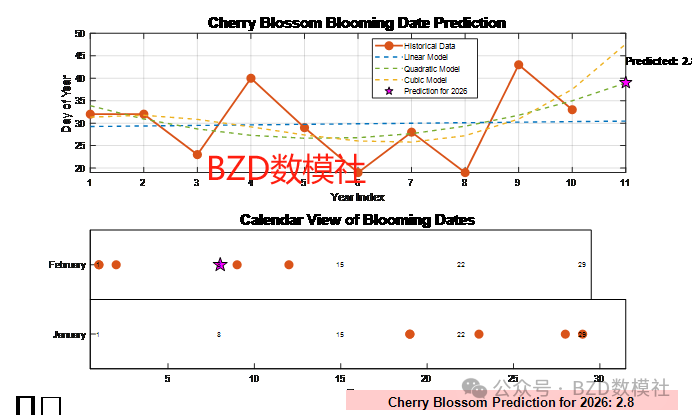
我们针对樱花-华东地区数据建立回归模型进行示例说明,建立线性、二次、三次、移动平均。并根据结果进行加权平均,权重分配是基于各个模型的预测误差(RMSE)——误差越小的模型在最终预测中获得更高的权重。得到结果如下所示
问题三、根据 2026 年清明假期天气预报和花期预测拟一份清明踏青赏花自由行攻略。
问题三的目标是通过构建一个优化模型来选择最合适的清明踏青赏花自由行路径。这个路径选择是基于预测的2026年清明假期的天气情况以及花卉的开花时间(始期和花期)。
约束条件:
l天气情况约束:根据问题一的天气预测,选择出行日期和出行地区时需要满足天气条件(如降雨概率、气温等)。例如,在降雨概率较大的地区避免出行
l花卉开花时间约束:根据问题二的花卉开花时间预测,选择赏花地点时需要考虑花卉的开花时间(始期)和花期,确保在最佳的赏花时期出行。
目标:
最优路径选择:选择一条最佳的赏花路线,保证既能在最佳赏花期到达各个花卉地点,又能避开不利天气(如降雨)。
旅游体验优化:除了花卉的开花时间和天气条件外,还需要考虑其他因素,如旅行的交通便捷度、各赏花地之间的距离、游客的兴趣偏好等。
为了构建优化模型,我们可以将其视为一个多目标优化问题,并采用整数幾性规划(ILP)或混合整数线性规划(MILP)来求解。
约束条件
天气约束:
-基于问题一的天气预报数据,对于每个可能的旅游日期,需检䨐相应地区的天气状况(如是否有降雨)。如果某个景点的天气不适合赏花,则将该景点的选择设为不可行(例如,某些景点可能需要避开雨天)。
-例如,若第
个景点的开始日期和结束日期在预测的降雨日期范围内,则该景点在该日期下不可选。
花期约束:
求解方法
-混合整数线性规划(MILP):可以使用 linprog 或 intlinprog 函数来求解此类优化问题。这些求解器能够处理包括整数变量在内的线性优化问题。
-启发式算法:如果问题规模较大,可以考虑使用遗传算法,模拟退火,蚁群算法等启发式方法来近似求解该问题
最终得到类似于下图的出行规划图
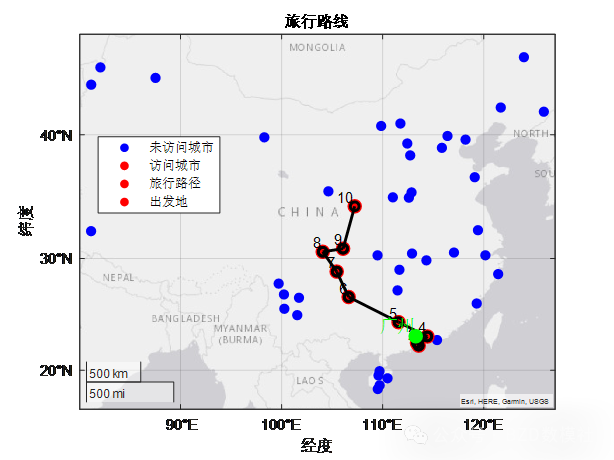
注释:该图并非结果是问题三预期结果图。本图实际为其他比赛路径优化结果图
问题四、拟一份报告, 给地方政府提供一些具体措施, 延长“ 赏花经济” 产业链, 使“ 赏花经济” 拥有“ 超长花期”, 并建立数学模型说明采取这些措施后可能给地方带来的经济效益。
八仙过海郭显神通即可