直接在Excel中用Python Matplotlib/Seaborn/Plotly......
本次分享如何利用pyxll包,实现直接在Excel中使用Python Matplotlib/Seaborn/Plotly等强大可视化工具。
pyxll配置
- pyxll安装
pip install pyxll
pyxll install- pyxll自定义方法
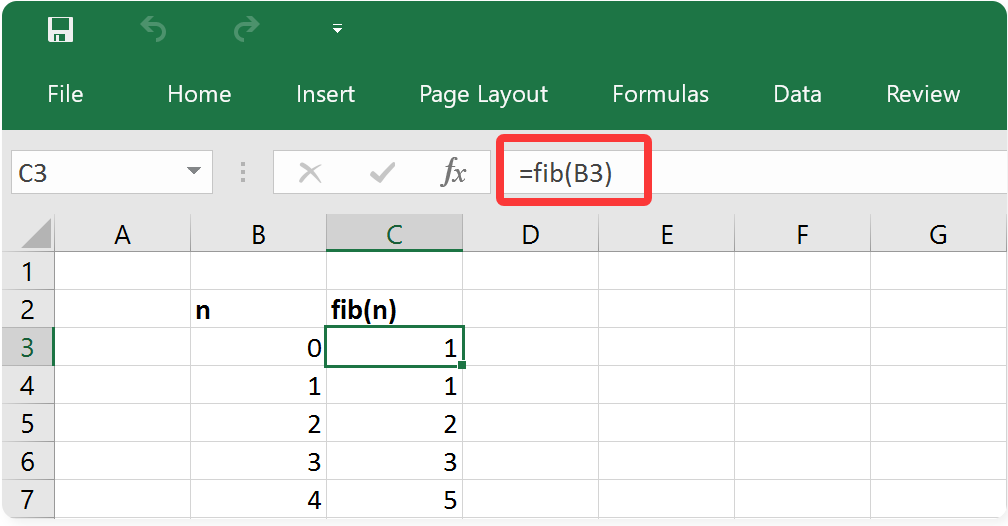
例如,自定义一个计算斐波那契数的方法fib,并使用pyxll装饰器@xl_func tagged,
from pyxll import xl_func@xl_func
def fib(n):"Naiive Fibonacci implementation."if n == 0:return 0elif n == 1:return 1return fib(n-1) + fib(n-2)- 修改pyxll的配置文件pyxll.cfg
[PYXLL]
modules = <add the name of your new module here> #这里添加自定义方法的名称[PYTHON]
pythonpath = <add the folder containing your Python module here> #这里添加自定义方法的路径- excel中使用自定义方法fib
Excel中使用Matplotlib
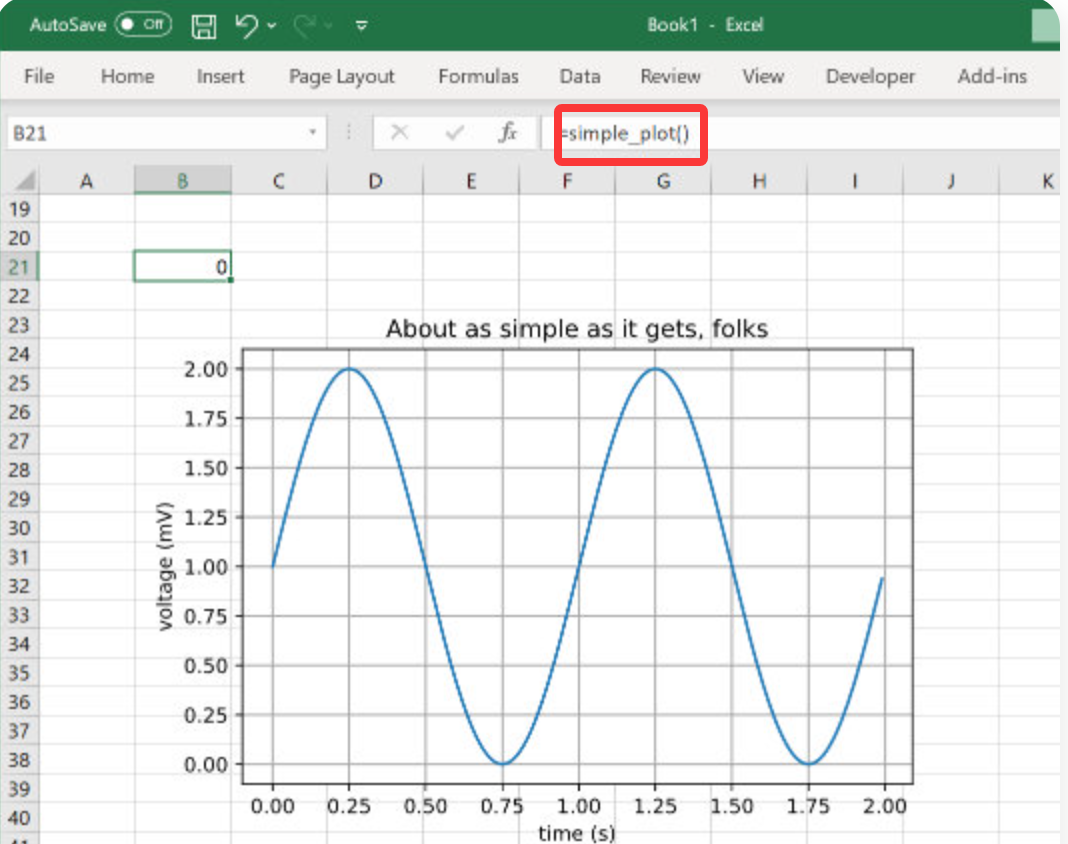
- 定义matplotlib画图方法simple_plot
from pyxll import xl_func, plot
import matplotlib
import matplotlib.pyplot as plt
import numpy as np@xl_func # pyxll装饰器tagged
def simple_plot(): #定义matplotlib画图函数simple_plott = np.arange(0.0, 2.0, 0.01)s = 1 + np.sin(2 * np.pi * t)fig, ax = plt.subplots()ax.plot(t, s)ax.set(xlabel='time (s)', ylabel='voltage (mV)',title='About as simple as it gets, folks')ax.grid()plot(fig)- Excel中使用matplotlib画图方法simple_plot
当然,我们可以将更多matplotlib画图方法搬到excel中,
matplotlib是最常用的Python可视化工具,你可以使用matplotlib绘制任何图表。
👉matplotlib教程:20w字+数百张图形+1W行代码+详细代码注释+学习交流群
Excel中使用Seaborn
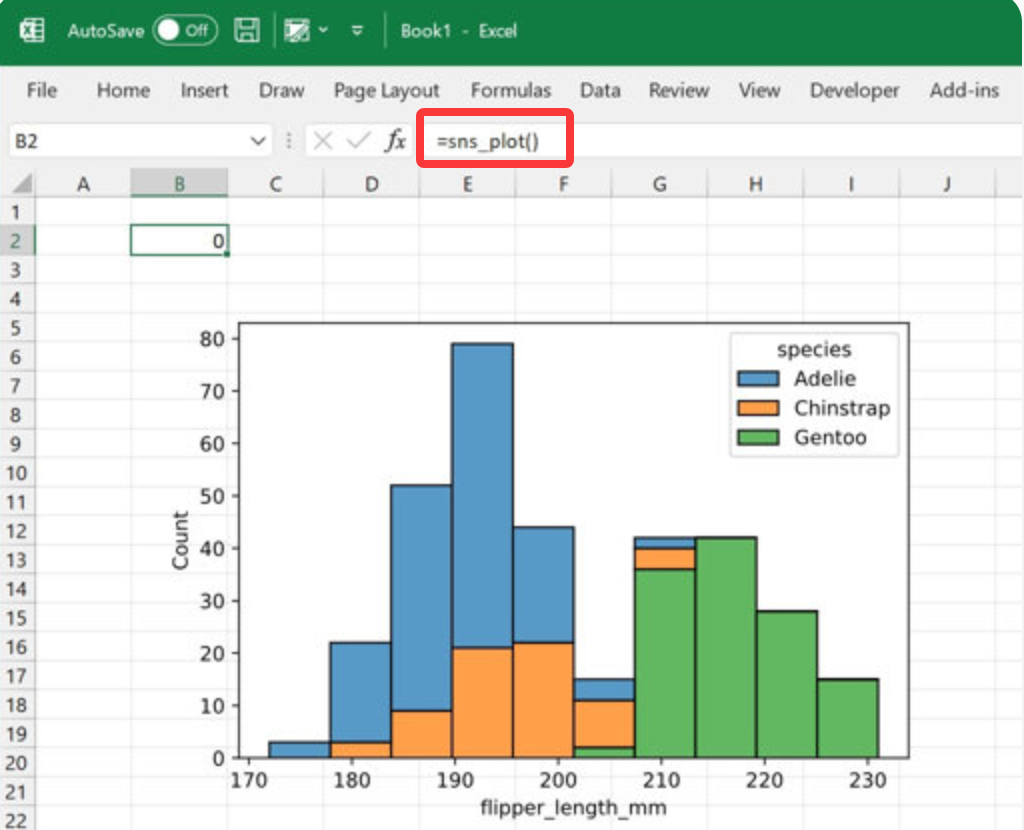
- 定义seaborn画图方法sns_plot
from pyxll import plot, xl_func
import seaborn as sns@xl_func # 装饰器tagged
def sns_plot(): # 定义seaborn方法penguins = sns.load_dataset("penguins")sns.histplot(data=penguins, x="flipper_length_mm", hue="species", multiple="stack")plot()- 使用seaborn画图方法sns_plot
同样,我们可以将更多seaborn画图方法搬到excel中.
Seaborn几行代码即可输出美美的图形,广受好评!
👉seaborn教程:12.3万字+500多张图形+8000行代码
pyxll功能远不止这些,同时他的缺陷也很多,可自行学习。
直接在Excel中用Python Matplotlib/Seaborn......