如何在 C# 和 .NET 中打印 DataGrid
DataGrid 是 .NET 架构中一个功能极其丰富的组件,或许也是最复杂的组件之一。写这篇文章是为了回答“我到底该如何打印 DataGrid 及其内容”这个问题。最初即兴的建议是使用我的屏幕截图文章来截取表单,但这当然无法解决打印 DataGrid 中虚拟显示的无数行数据的问题。后来想了想,这应该很简单,我只需使用 GDI+ 遍历 DataGrid 中的行并打印其内容即可。其实,DataGrid 比这更复杂一些,因为它本身并不包含数据。数据包含在 DataSet 中。因此,最终确定的方法是从 DataGrid 中捕获颜色和字体属性用于打印输出,并从 DataSet 中捕获行中的信息。为了将 DataGridPrinter 的绘制功能封装到 Printer 中,我创建了 DataGridPrinter 类,如下图 2 所示。此类将 DataGrid、PrintDocument 和 DataTable 传递给其构造函数,并利用这些对象将 DataGrid 绘制到打印机。
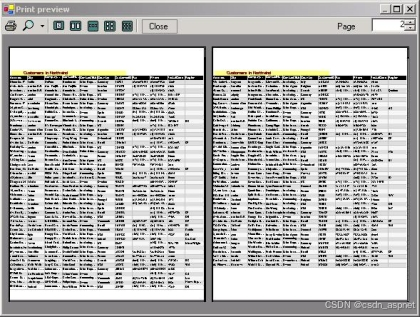
图 1. Northwind DataGrid 的打印预览
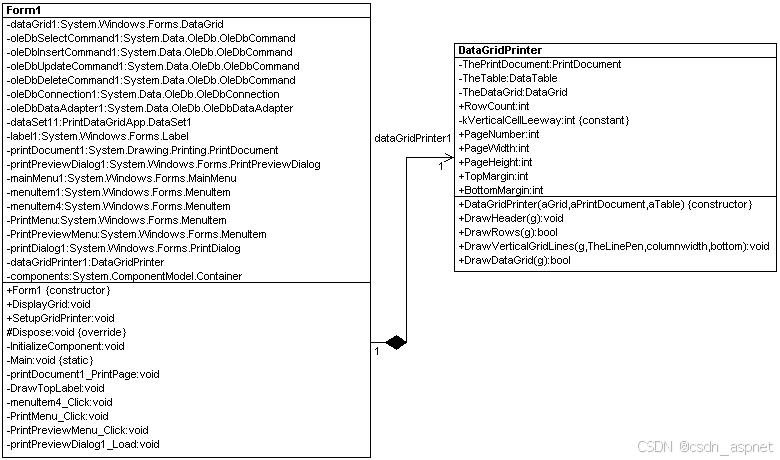
图 2. DataGridPrinter 类 UML 设计(使用 WithClass 2000 进行逆向工程)
DataGridPrinter 在表单的构造函数中构建,因此它可以被所有打印功能(打印、打印预览等)使用。下面是构建 DataGridPrinter 的代码:
void SetupGridPrinter()
{
dataGridPrinter1 =new DataGridPrinter(dataGrid1, printDocument1,
dataSet11.Customers);
}
一旦构建了 DataGridPrinter,您就可以通过在 Print Page 事件处理程序中调用其 DrawDataGrid 方法将 DataGrid 绘制到打印机上:
private void printDocument1_PrintPage(object sender,System.Drawing.Printing.PrintPageEventArgs e)
{
Graphics g = e.Graphics;
// Draw a label title for the grid
DrawTopLabel(g);
// draw the datagrid using the DrawDataGrid method passing the Graphics surface
bool more = dataGridPrinter1.DrawDataGrid(g);
// if there are more pages, set the flag to cause the form to trigger another print page event
if (more == true)
{
e.HasMorePages =true;
dataGridPrinter1.PageNumber++;
}
}
PrintPage 事件由 PrintDocument 中的 Print 方法和 PrintPreviewDialog 的 ShowDialog 方法触发。下面是窗体将 DataGrid 打印到打印机的方法:
private void PrintMenu_Click(object sender, System.EventArgs e)
{
// Initialize the datagrid page and row properties
dataGridPrinter1.PageNumber = 1;
dataGridPrinter1.RowCount = 0;
// Show the Print Dialog to set properties and print the document after ok is pressed.
if (printDialog1.ShowDialog() == DialogResult.OK)
{
printDocument1.Print();
}
}
现在让我们来看看 DataGridPrinter 方法的内部实现。DataGridPrinter 类中有两个主要方法用于执行所有绘制操作:DrawHeader 和 DrawRows。这两个方法都从 DataGrid 和 DataTable 中提取信息来绘制 DataGrid。以下是绘制 DataGrid 行的方法:
public bool DrawRows(Graphics g)
{
try
{
int lastRowBottom = TopMargin;
// Create an array to save the horizontal positions for drawing horizontal gridlines
ArrayList Lines = new ArrayList();
// form brushes based on the color properties of the DataGrid
// These brushes will be used to draw the grid borders and cells
SolidBrush ForeBrush = new SolidBrush(TheDataGrid.ForeColor);
SolidBrush BackBrush = new SolidBrush(TheDataGrid.BackColor);
SolidBrush AlternatingBackBrush = new SolidBrush
TheDataGrid.AlternatingBackColor);
Pen TheLinePen = new Pen(TheDataGrid.GridLineColor, 1);
// Create a format for the cell so that the string in the cell is cut off at the end of
the column width
StringFormat cellformat = new StringFormat();
cellformat.Trimming = StringTrimming.EllipsisCharacter;
cellformat.FormatFlags = StringFormatFlags.NoWrap | StringFormatFlags.LineLimit;
// calculate the column width based on the width of the printed page and the # of
columns in the DataTable
// Note: Column Widths can be made variable in a future program by playing with the GridColumnStyles of the
// DataGrid
int columnwidth = PageWidth / TheTable.Columns.Count;
// set the initial row count, this will start at 0 for the first page, and be a different
value for the 2nd, 3rd, 4th, etc.
// pages.
int initialRowCount = RowCount;
RectangleF RowBounds = new RectangleF(0, 0, 0, 0);
// draw the rows of the table
for (int i = initialRowCount; i < TheTable.Rows.Count; i++)
{
// get the next DataRow in the DataTable
DataRow dr = TheTable.Rows[i];
int startxposition = TheDataGrid.Location.X;
// Calculate the row boundary based on teh RowCount and offsets into the page
RowBounds.X = TheDataGrid.Location.X; RowBounds.Y = TheDataGrid.Location.Y +
TopMargin + ((RowCount - initialRowCount) + 1) * (TheDataGrid.Font.SizeInPoints +
kVerticalCellLeeway);
RowBounds.Height = TheDataGrid.Font.SizeInPoints + kVerticalCellLeeway;
RowBounds.Width = PageWidth;
// save the vertical row positions for drawing grid lines
Lines.Add(RowBounds.Bottom);
// paint rows differently for alternate row colors
if (i % 2 == 0)
{
g.FillRectangle(BackBrush, RowBounds);
}
else
{
g.FillRectangle(AlternatingBackBrush, RowBounds);
}
// Go through each column in the row and draw the information from the
DataRowfor(int j = 0; j < TheTable.Columns.Count; j++)
{
RectangleF cellbounds = new RectangleF(startxposition,
TheDataGrid.Location.Y + TopMargin + ((RowCount - initialRowCount) + 1) *
(TheDataGrid.Font.SizeInPoints + kVerticalCellLeeway),
columnwidth,
TheDataGrid.Font.SizeInPoints + kVerticalCellLeeway);
// draw the data at the next position in the row
if (startxposition + columnwidth <= PageWidth)
{
g.DrawString(dr[j].ToString(), TheDataGrid.Font, ForeBrush, cellbounds, cellformat);
lastRowBottom = (int)cellbounds.Bottom;
}
// increment the column position
startxposition = startxposition + columnwidth;
}
RowCount++;
// when we've reached the bottom of the page, draw the horizontal and vertical grid lines and return true
if (RowCount * (TheDataGrid.Font.SizeInPoints + kVerticalCellLeeway) >
PageHeight * PageNumber) - (BottomMargin + TopMargin))
{
DrawHorizontalLines(g, Lines); DrawVerticalGridLines(g, TheLinePen, columnwidth,
lastRowBottom);
return true;
}
}
// when we've reached the end of the table, draw the horizontal and vertical gridlines and return false
DrawHorizontalLines(g, Lines);
DrawVerticalGridLines(g, TheLinePen, columnwidth, lastRowBottom);
return false;
}
catch (Exception ex)
{
MessageBox.Show(ex.Message.ToString());
return false;
}
该方法遍历 DataTable 中的每一行并绘制数据。该方法使用 DataGrid 的属性,用适当的颜色绘制每一行,并使用 DataGrid 的字体绘制每个字符串。如果该方法到达页面底部,则会中断并返回 true,以便将 DataGrid 的剩余部分打印到下一页。
改进:
利用 DataGrid 的 TableStyles 属性中存储的 DataGridColumnStyle 类,可以极大地改进此类。这些属性允许您为某些列指定不同的列宽以及不同的文本对齐方式。
如果您喜欢此文章,请收藏、点赞、评论,谢谢,祝您快乐每一天。